When a retirement portfolio veers from its planned path, is it better to count on reversion-to-path or adjust the plan? In his March 2019 paper entitled “Managing to Target: Dynamic Adjustments for Accumulation Strategies”, Javier Estrada employs a simple retirement portfolio model to compare outcomes for sticking to the plan (S2P) with 13 dynamic strategies of three types:
- Five effective but impractical (EBI) dynamic contribution strategies. EBI1 at the end of each year contributes to or withdraws from the portfolio so that it stays exactly on track. EBI2, EBI3, EBI4 and EBI5 are similar but limit annual adjustments to no more than 5%, 10%, 15% and 20% above or below the prior-year contribution, respectively.
- Five feasible but limited (FBL) dynamic contribution strategies. FBL1, FBL2, FBL3, FBL4 and FBL5 also at end of each year contribute to or withdraw from the portfolio to help keep it on track, but limit changes to no more than 5%, 10%, 15%, 20% and 50% (FBL5) above or below the initial plan contribution, respectively.
- Three dynamic asset allocation (AA) strategies that every five years make portfolio asset allocations more aggressive (conservative) when the portfolio is below (above) plan. AA1, AA2 and AA3 limit changes in asset class allocations to 10%, 20% and 30%, respectively, compared to allocations five years ago.
His model portfolio consists of 39 annual contributions over 40 years, with 5% annualized real return (the historical average for 60% stocks and 40% bonds) and target value $1 million at retirement. He evaluates portfolio performance over 80 possible 40-year periods over 118 years. Using annual real (based on the U.S. Consumer Price Index) total returns for the S&P 500 Index and 10-year U.S. Treasury notes during 1900 through 2017, he finds that:
- Over the full sample period, stocks and bonds deliver annualized real total returns 6.4% and 1.6%, respectively, with annual volatilities 20.0% and 9.4%. Annual return correlation is 0.23.
- The S2P baseline translates to $8,347 annual inflation‐adjusted retirement portfolio contributions.
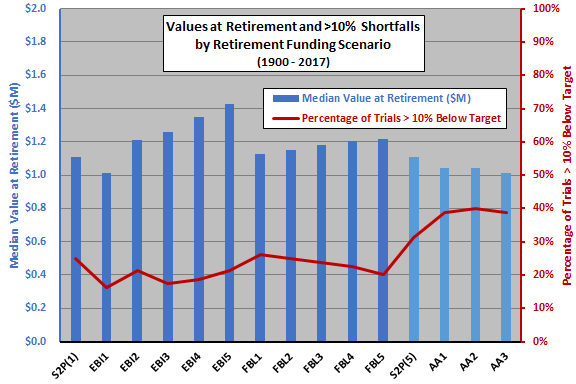
- In most cases, the specified dynamic contribution strategies (see the chart below):
- Increase portfolio median value at retirement and decrease the percentage of observations that fall below target by 10% compared to S2P.
- Work better with greater flexibility in contributions.
- The specified dynamic asset class allocation strategies underperform S2P.
The following chart, constructed from data in the paper, summarizes median portfolio values at retirement and percentages of 80 observations that fall at least 10% short of the target $1 million portfolio value at retirement for S2P and the 13 alternative dynamic strategies. S2P(1) and S2P(5) indicate annual and five-year portfolio rebalancing, respectively. Dynamic contributions (asset class allocations) generally improve (degrade) performance.

In summary, evidence suggests that adjusting contributions to keep retirement portfolios on track has merit, whereas adjusting asset class allocations does not.
Cautions regarding findings include:
- The sample period is short in terms of independent 40-year retirement portfolio buildup intervals (only about three).
- Performance data are gross, not net. Trading frictions associated with contributions and rebalancing actions, and any fund fees, would reduce returns.
- The body of research indicates that historical average is generally not a good predictor of asset returns.
For other perspectives, see results of this search.