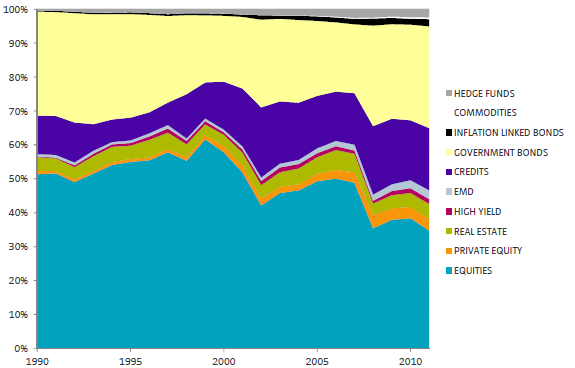
What is the aggregate posture of all investors or, said differently, the asset class allocation of the average investor? In their November 2012 paper entitled “Strategic Asset Allocation: The Global Multi-Asset Market Portfolio 1959-2011”, Ronald Doeswijk, Trevin Lam and Laurens Swinkels estimate the crowd-sourced relative market valuations of investments in ten asset classes: equities, private equity, listed and unlisted (commercial) real estate, high-yield bonds, emerging market debt, non-government bonds (mostly corporate bonds and mortgage-backed securities), government bonds, inflation-linked bonds, commodities and hedge funds since the beginning of 1990. They also estimate the relative valuations of four core asset classes (equities, commercial real estate, non-government bonds and government bonds) since the beginning of 1959. Using annual market valuation estimates from a variety of sources during 1990 through 2011 across all ten asset classes, and during 1959 through 2011 for the core subset, they find that:
- At the end of 2011:
- Market capitalization of global investments in the ten asset classes is $83.5 trillion.
- Equities, government bonds and non-government bonds comprise 34.7%, 30.0% and 18.4% of this total, respectively.
- Other asset classes are relatively small, ranging from 0.5% for commodities to 4.4% for commercial real estate.
- During 1990 through 2011, the share of total market valuation across the ten asset classes for:
- Equities declines from 51.4% to 34.7%.
- Non-government bonds rises from 11.4% 18.4%.
- Relatively small asset classes (outside of equities, government bonds and non-government bonds) rises 6.6% to 16.9%.
- During 1959 through 2011, the share of total market valuation across the four core asset classes for:
- Equities declines from 51.2% to 37.1% (with 2011 a record low, and maximums occurring in 1968 and 1999).
- Government bonds rises from 29.6% to 37.1%, close to the 1982 peak of 37.3% and well above average.
- Non-government bonds rises from 17.8% to 21.2%, well above average.
- Commercial real estate rises from 1.4% to 4.7%, well above average.
The following chart, taken from the paper, tracks the global aggregate investment allocations to ten asset classes during 1990 through 2011. “Credits” means non-government bonds, and “EMD” is emerging markets debt. Results suggest displacement of equities by non-government bonds and minor asset classes over this recent subperiod.

In summary, evidence indicates that investment allocations to equities are now low relative to other asset classes based on 21-year and 62-year histories.
The authors suggest that deviations from long-term averages might serve as valuation indicators for tactical asset allocation.
Cautions regarding findings include:
- As noted in the study, the real estate asset class consists of commercial properties only. Many individual investors have substantial investments in residential real estate.
- Some of the ten asset classes are inaccessible for many investors.