Is planning for the worst case paramount in asset class allocation? In their May 2012 paper entitled “Minimax: Portfolio Choice Based on Pessimistic Decision Making”, Steffen Schaarschmidt and Peter Schanbacher examine the worst case scenario as a basis for portfolio optimization (Minimax strategy). Specifically, each year they run Monte Carlo simulations based on the last 250 trading days of returns to model all possible return scenarios for all possible long-only portfolio allocations. They then choose for the next year the portfolio allocation with the largest return for the worst case scenario. Using daily returns for the S&P 500 Index, Barclays Aggregate Bond Index, a Real Estate Investment Trust (REIT) index and the S&P GSCI Index, and the contemporaneous yield on 90-day Treasury bills as the risk-free rate, during 1990 through 2010, they find that:
- Over the sample period, the REIT index has the highest gross return, and bonds have the highest gross daily Sharpe ratio. Correlations of daily returns between asset class proxies are all low except for that between the S&P 500 Index and the REIT index (0.65).
- Minimax performs well based on standard risk measures compared to representative pension fund fixed weights (60% stocks, 20% bonds, 10% real estate, 10% commodities), equal weights, minimum variance (minimizing lagged volatility) and long-only mean-variance optimization (maximizing lagged return/risk).
- Minimax has the second highest gross return and the second highest gross daily Sharpe ratio.
- Mean-variance optimization has the highest gross return and the highest gross daily Sharpe ratio, but also the highest turnover.
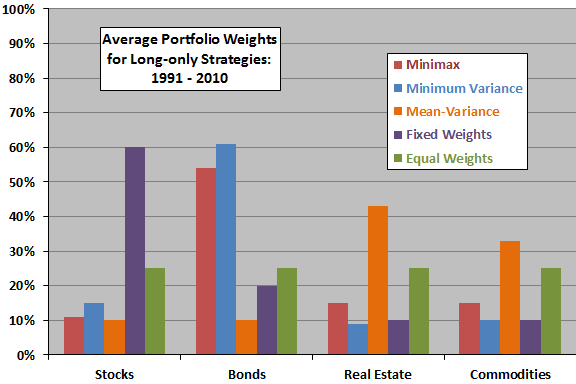
- Long-only Minimax on average allocates 11% to stocks, 54% to bonds, 15% to real estate and 15% to commodities, somewhat similar to minimum variance (see the chart below).
- Sensitivity tests indicate that:
- Use of annual rather than daily returns for calculations makes Minimax less attractive.
- Daily rather than annual rebalancing makes Minimax more attractive.
The following chart, constructed from data in the paper, summarizes average portfolio weights for the Minimax and alternative asset allocation strategies over the entire sample period. Average allocations for Minimax and minimum variance are similar, with the former somewhat more broadly diversified.

In summary, evidence indicates that strategic asset allocation based on (simulated) worst case return streams has attractive aspects.
Cautions regarding findings include:
- As noted in the paper, computational complexity limits the number of asset classes considered for the Minimax strategy. Even for a few asset classes, computations may be burdensome for many investors.
- Use of indexes to represent asset classes ignores the costs involved in creating tradable assets from them (trading frictions and management fees). Incorporating such costs could affect findings.
- In addition, applying trading frictions to account for the variation in turnover across strategies may affect relative attractiveness of the strategies.
- A 21-year sample period is not long for analysis of annual performance metrics.
- Testing multiple allocation strategies on the same set of of asset class returns introduces data snooping bias, such that results for the best-performing strategy incorporate some luck.
See “Active Asset Allocation via Drawdown Control” for a somewhat similar concept.