Trading Calendar – January
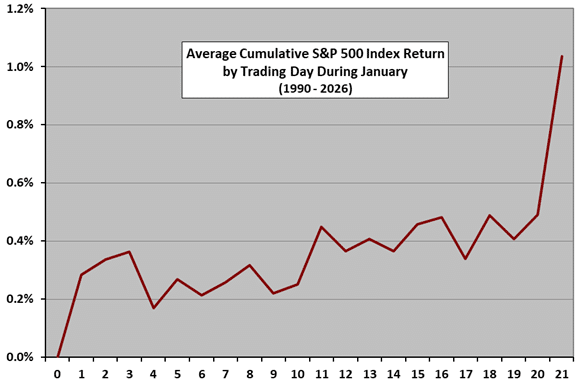
The following chart shows the average month-to-date percentage change in the S&P 500 Index by trading day during January from 1990 through 2026. Day 0 represents the December close. It shows that the index during January tends to jump at the beginning and end. We have not used data for trading day 22, because most Januarys do not have 22 trading days. Also, sample size is at most only 37 for specific trading days, so results are only mildly suggestive rather than predictive. For 1990-2026, 23 Januarys have been winners and 14 losers.
Return to the Trading Calendar to find other monthly profiles.