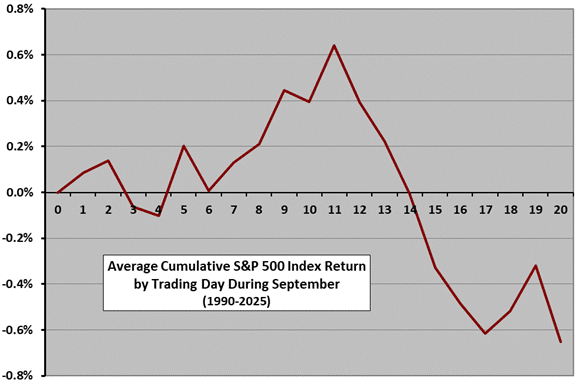
Trading Calendar – September
The following chart shows the average month-to-date percentage change in the S&P 500 index by trading day during September from 1990 through 2025. Day 0 represents the August close. We insert four dummy trading days after 9/10/01 with the same close as 9/10/01 to avoid calendar misalignment for the balance of the month. The index has typically drifted higher during the first half of September and then reversed to loss during the second half of the month. We have not used data for trading day 21, because most Septembers do not have 21 trading days. Also, sample size is only 31-36 for specific trading days, so these results are only mildly suggestive rather than predictive. For 1990-2025, 19 Septembers have been winners and 17 losers.
Excluding 2001 generates a graph similar in shape but slightly higher across the month.
Return to the Trading Calendar to find other monthly profiles.