Five years ago, a reader noted and asked: “CNBC’s Fast Money cited a ‘seasonal’ strategy described in Barron’s, as follows: Go long the market from Wal-Mart’s (WMT) earnings release until Alcoa’s (AA) earnings release and short the market from Alcoa’s earnings release until Wal-Mart’s earnings release (earnings season). Over the last six years, the market has been up nicely during the former period and down an average 8% during the latter. Any testing on this?” To test this strategy, we assemble AA earnings release dates and WMT earnings release dates since the beginning of 1997 (the earliest available for AA), estimating the date for one missing WMT release. This sample period is much longer than that cited. Using these earnings release dates, daily dividend-adjusted closes for S&P 500 SPDR (SPY) and ProShares Short S&P500 (SH) and the daily 13-week Treasury bill (T-bill) yields over the period 2/25/97 (6/21/06 for SH) through 10/8/13 (67 quarters), we find that:
The average length of the earnings seasons (off-seasons) as defined is 38 (53) calendar days. Over the entire sample period, the average total return for SPY during the 66 (67) earnings seasons (off-seasons) is +0.5% (+1.4%), with standard deviations 5.7% (6.1%). The spread in average returns between earnings seasons and off-seasons for the first (second) half of the sample is -1.1% (-0.6%). Rationalizing to account for different durations, the average daily total SPY return during earnings seasons (off-seasons) is 0.011% (0.024%). While the broad stock market does appear to be stronger during the earnings off-season, shorting during earnings season probably loses money on average.
For a cumulative performance perspective, consider two strategies:
- AA-WMT Long Only is in cash (long SPY) during the earnings season (off-season).
- Buy and Hold SPY is the benchmark.
Trading assumptions are as follows:
- Initial investment in each strategy is $100,000 at the close on 2/25/97.
- AA-WMT Long Only trades occur at the close on AA/WMT earnings release dates.
- Switching friction is 0.125% per trade for AA-WMT Long Only (but dividend reinvestment is frictionless).
- The return on cash is the T-bill yield.
- Ignore tax implications of trading.
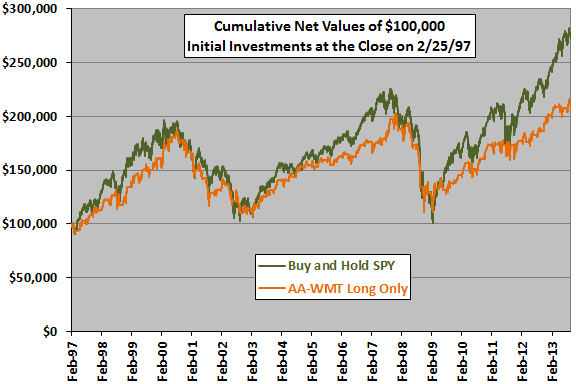
The following chart compares the cumulative net values of $100,000 initial investments in the two strategies over the entire sample period. AA-WMT Long Only generally underperforms Buy and Hold SPY, with a natural tendency to fall behind during bull markets and catch up during bear markets. Terminal values are $207,348 for AA-WMT Long Only and $271,635 for Buy and Hold SPY.
With zero friction, the gross cumulative value of AA-WMT Long Only is very similar to that of Buy and Hold SPY.
What about shorting stocks during earnings season?
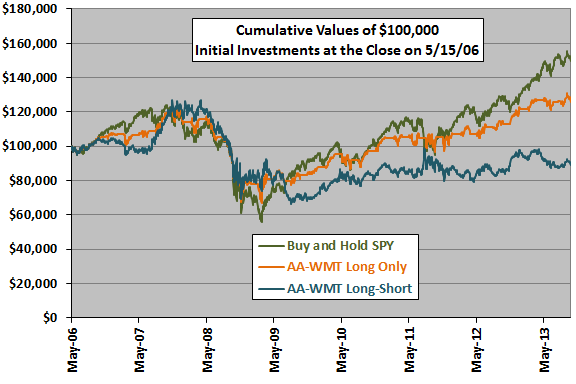
The next chart compares the cumulative net values of $100,000 initial investments in the above two strategies plus a third strategy that holds SH rather than T-bills during earnings season (AA-WMT-Long-Short) since availability of SH. For this third strategy, switching friction is doubled to 0.25%. AA-WMT-Long-Short performs relatively well during the 2008 crash but ultimately lags well behind both AA-WMT Long Only and Buy and Hold SPY.
With zero friction, the gross cumulative value of AA-WMT Long Only is again to that of Buy and Hold SPY, but AA-WMT Long-Short still lags (roughly breaking even over the sample period).
For another perspective, we look at daily performance statistics for the three strategies.
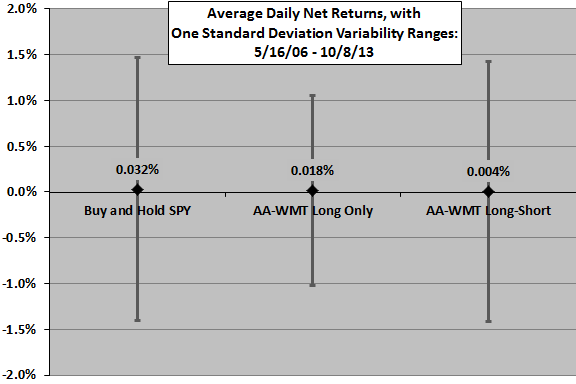
The final chart compares average daily net returns for Buy and Hold SPY, AA-WMT Long Only and AA-WMT Long-Short since May 2006, with one standard deviation variability ranges. AA-WMT Long Only suppresses volatility but sacrifices average return . AA-WMT Long Short does not suppress volatility and captures little average return.
Setting trading friction to zero increases the average daily return of the AA-WMT Long Only (AA-WMT Long-Short) strategy to 0.022% (0.012%).
In summary, evidence from simple tests does not support belief that going to cash or (especially) shorting the broad U.S. stock market during earnings season reliably beats buy-and-hold, but does support belief that the market tends to be relatively weak during earnings season.
Cautions regarding findings include:
- Going to some asset other than cash during earnings season may improve performance of the AA-WMT Long Only strategy.
- The sample period for analyzing the long-short strategy is modest, especially in terms of numbers of bull and bear markets.
See “Stock Returns During and Between Earnings Seasons” for results of tests on a different definition of earnings season.