A subscriber commented and asked:
“Some have suggested that the end-of-the-month effect benefits monthly simple moving average strategies that trade on the last day of the month. Is there an optimal day of the month for long-term SMA calculation and does the end-of-the-month effect explain the optimal day?”
To investigate, we compare 21 variations of a 10-month simple moving average (SMA10) timing strategy generated by shifting the monthly return calculation cycle relative to trading days from the end of the month (EOM). Specifically, the 21 variations represent calculation cycles ranging from 10 trading days before EOM (EOM-10) to 10 trading days after EOM (EOM+10). We apply the strategy to the S&P 500 Index as a proxy for the U.S. stock market. The strategy holds the S&P 500 Index (cash) whenever the index is above (below) its SMA10 as of the most recent monthly calculation. Using daily S&P 500 Index closes and 3-month Treasury bill (T-bill) yields as the return on cash during January 1990 through mid-June 2019, we find that:
To allow calculation of the initial 10-month SMA, the first month of strategy returns is November 1990. Modeling assumptions are:
- Trades occur at a daily close, with SMA10 calculation slightly anticipated such that trades coincide with signals.
- While out of stocks, cash earns the T-bill yield.
- Stock market entry and exit trading frictions are a constant 0.1% of portfolio value over the sample period (actual trading frictions likely decline over the sample period) .
- Ignore dividends and tax implications of trading.
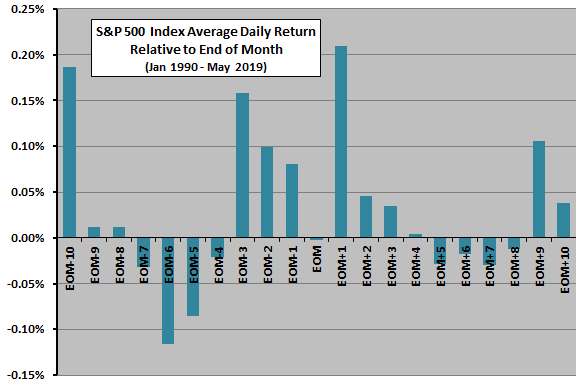
As background, the following chart summarizes average daily S&P 500 Index returns relative to EOM over the entire sample period. Concentration of positive returns around EOM generally confirms the turn-of-the-month (TOTM) effect as explored in “Turn-of-the-Month Effect Persistence and Robustness”.
Could this variation in daily returns materially affect SMA calculations?
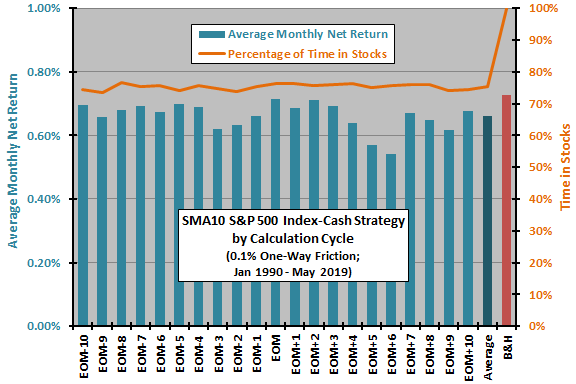
The next chart compares average monthly net returns and percentages of time in stocks for the 21 variations in the SMA10 S&P 500 Index-cash strategy cycle from EOM-10 through EOM+10. Sample size is 318 months of returns for each variation. For comparison, the chart includes results for the average of all SMA10 S&P 500 Index-cash variations and for buying and holding the index.
Average returns suggest that the EOM cycle (0.71% per month) is near optimal. The average monthly return across all cycles (0.66%) is lower than that for buy-and-hold (0.73%).
Time-in-stocks ranges from 73.5% for EOM-9 to 76.7% for EOM-8. The number of S&P 500 Index-cash switches ranges from 33 for EOM to 51 for EOM+6.
The different start dates for cycle variations slightly confound findings by using slightly different sample periods.
For another perspective, we look at compound annual growth rates (CAGR) and maximum drawdowns (MaxDD) across variations.
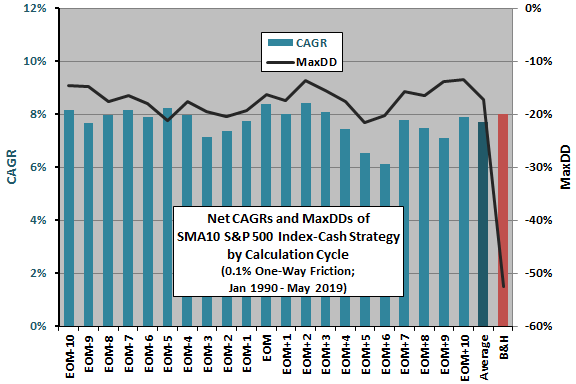
The next chart summarizes net CAGRs and MaxDDs for the 21 variations in the SMA10 S&P 500 Index-cash strategy cycle. For comparison, the chart includes results for averages of all SMA10 S&P 500 Index-cash variations and for buying and holding the index.
CAGRs range from 6.1% for EOM+6 to 8.4% for EOM and EOM+2. Again, the widely used EOM calculation cycle is near optimal. The average CAGR for all 21 variations is 7.7%, compared to 8.0% for buy-and-hold. Only 6 of 21 variations beat buy-and-hold.
MaxDDs range from -21.5% for EOM+5 to -13.4% for EOM+10, compared to -52.6% for buy-and-hold. The timing strategy consistently suppresses MaxDD.
Again, the different start dates for cycle variations slightly confound findings.
Next, we depict performance trajectories.
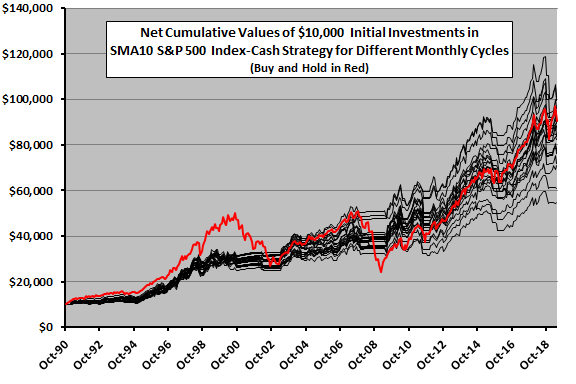
The next chart tracks net cumulative values of $10,000 initial investments in each of the 21 variations in the SMA10 S&P 500 Index-cash strategy cycle, and in buying and holding the index based on EOM returns (red line). To the extent that differences in outcomes are reliable, investors can achieve the best outcome by using an EOM monthly cycle (terminal value $100,969). To the extent the variation is random, investors should expect an SMA10 S&P 500 Index-cash outcome near the middle of the pack of strategy variations (average terminal value $83,970, compared to $90,528 for buy-and-hold).
An investor with belief in randomness as the driver, and sufficient funds, could employ several cycles to avoid an unlucky outcome (and achieve a middle-of-the-pack outcome, with a shallow MaxDD).
Results generally suggest that SMA10 market timing performance is sample specific, depending on the frequency of deep bear markets in the sample.
Again, the different start dates for cycle variations slightly confound findings, with start and end dates for EOM-10 and EOM+10 different by about a month.
Are cycle performances stable over the sample period?
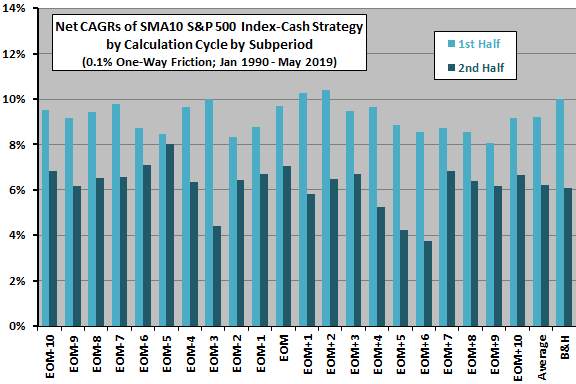
The final chart compares net CAGRs for the 21 variations in the SMA10 S&P 500 Index-cash strategy cycle for the first and second halves of the sample period (break point about the end of 2003). Results suggest that:
- During the first half of the sample period, EOM+2 (10.4%) is optimal while EOM (10.2%) is in fifth place.
- During the second half of the sample period, EOM-5 (8.0%) is optimal while EOM (7.1%) is in third place and EOM+2 (6.1%) is in eleventh place.
In other words, an investor using the optimal cycle from the first half of the sample to time the market during the second half would have been disappointed in the cycle choice.
In summary, evidence from simple tests on the S&P 500 Index offer little support for a belief that investors using monthly simple moving averages to time U.S. stocks should prefer a calculation cycle anchored on a day other than the end of the month.
Cautions regarding findings include:
- As noted, the different start dates for cycle variations slightly confound findings by using slightly different sample periods.
- Ignoring dividends hurts buy-and-hold more than the market timing strategy variations. The former would capture all dividends, while the latter would miss about a quarter of dividends (based on time in stocks). It is also possible that using total returns to calculate SMA10 would change some signals.
- Testing many variations on a strategy with the same data introduces data snooping bias, such that results for the best (worst) calculation cycle tends to overstate (understate) out-of-sample performance. In other words, to the degree randomness drives differences, as noted above, the middle of the pack is a more rational expectation than the extremes.
- Results may not apply to other assets, especially those very different from U.S. stocks.
For comparison/corroboration, see: