Trading Calendar – June
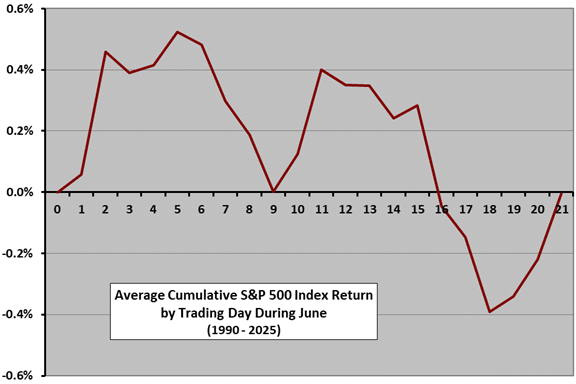
The following chart shows the average month-to-date percentage change in the S&P 500 index by trading day during June from 1990 through 2025. Day 0 represents the May close. It shows that the index during June tends to be about neutral, with a month-end dip. We have not used data for trading day 22, because many Junes do not have 22 trading days. Also, sample size is only 29-36 for specific trading days, so these results are only mildly suggestive rather than predictive. For 1990-2025, 22 Junes have been winners and 14 losers.
Return to the Trading Calendar to find other monthly profiles.