Can machine learning (ML) algorithms improve stock picking? In the May 2020 version of their paper entitled “Stock Picking with Machine Learning”, Dominik Wolff and Fabian Echterling apply ML to insights from financial research to assess stock picking abilities of different ML algorithms at a weekly horizon. Their potential return predictor inputs include equity factors (size, value/growth, quality, profitability and investment), additional firm fundamentals, and technical indicators (moving averages, momentum, stock betas and volatilities, relative strength indicators and trading volumes). Their ML algorithms include Deep Neural Networks, Long Short-Term Neural Networks, Random Forest, Boosting and Regularized Logistic Regression. They apply these algorithms separately and in combination (by averaging individual predictions) to historical S&P 500 constituents. They test a long-only strategy that each week holds the equal-weighted 50, 100 or 200 stocks with the highest return predictions. Their benchmark is an equal-weighted portfolio of all S&P 500 stocks. They assume a 3-month lag for all fundamental data to avoid look-ahead bias. Using Wednesday (or next trading day if the market is not open on Wednesday) open prices and fundamental data for the historical components of the S&P 500 during January 1999 through December 2019 (1,164 total stocks), they find that:
- ML algorithms substantially beat the equal-weighted benchmark on a gross basis. For example, for an equal-weighted portfolio of the 50 stocks with the highest predicted returns:
- Average annualized gross returns are in the range 15.3% to 17.6% for individual ML algorithms, compared to 10.2% for the benchmark.
- Annualized volatilities are in the range 23.5% to 28.2%, compared to 18.6% for the benchmark.
- Annualized gross Sharpe ratios are in the range 0.60 to 0.73, compared to 0.55 for the benchmark.
- Maximum drawdowns are in the range -46% to -53%, compared to -55% for the benchmark.
- Annual portfolio turnovers are in the range 16.7 to 38.9, compared to 0.79 for the benchmark. Breakeven trading frictions for position changes with respect to the benchmark are in the range 0.09% to 0.18%.
- Combining ML algorithms modestly improves average return, Sharpe ratio and maximum drawdown.
- Sharpe ratio-optimal portfolio size varies across ML algorithms, but is around 50 for most.
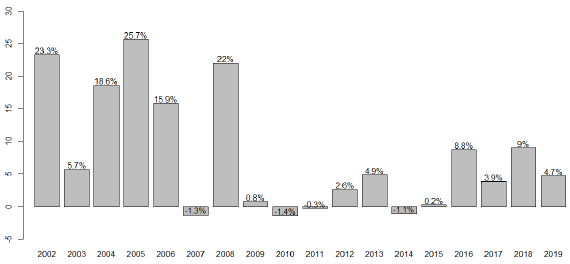
- The combination of ML algorithms beats the equal-weighted benchmark in 15 of 19 test period years. However, outperformance is weaker in the second half, perhaps due to increasing use of ML algorithms (see the chart below).
- After controlling for common risk factors, most ML algorithms have exhibit a weekly gross alpha around 0.2%. All have significant exposures to market, value, profitability and betting-against-beta factors. The investment factor is significant only for regression-based ML algorithms, and the momentum factor is significant only for Random Forest and neural network algorithms. The size factor is never significant.
- Logistic regression works better than other ML algorithms with fundamental data. Non-linear algorithms (all except logistic regression) work better than logistic regression with technical indicators and, in fact, appear not to benefit from fundamental data.
- Results are similar for the STOXX Europe 600 as an alternative stock universe.
The following chart, taken from the paper, summarizes gross outperformance of the combination of ML algorithms compared to the equal-weighted benchmark by calendar year. While beating the benchmark in 15 out of 19 years, gross outperformance during the last decade is modest.
In summary, evidence indicates that machine learning algorithms may be of value in picking large-capitalization stocks for investors bearing very low trading frictions.
Cautions regarding findings include:
- As noted, findings are gross, not net. Accounting for weekly portfolio turnover frictions would reduce reported returns and Sharpe ratios.
- The methodology (particularly the combination of ML algorithms) is beyond the reach of most investors, who would bear fees for delegating to a fund manager.
For testing of a practical implementation, see “Online, Real-time Test of AI Stock Picking”.