Is there a reliable and exploitable cross-sectional relationship between beta and future returns? In the October 2010 draft of their paper entitled “Betting Against Beta”, Andrea Frazzini and Lasse Pedersen investigate exploitability of historical beta within U.S. equities and 19 other stock markets, across 20 global equity markets, and for Treasuries, corporate bonds and commodity futures. They argue that leverage-inhibited investors overweight high-beta assets as a leverage substitute (preferring unleveraged risky assets to leveraged safe assets), and this demand results in overpricing of high-beta assets relative to low-beta assets. Their principal investigatory tool is a market-neutral “betting-against-beta” portfolio that is long low-beta assets (leveraged up to an aggregate beta of one) and short high-beta assets (de-leveraged to an aggregate beta of one), reformed monthly. Calculations of historical beta vary somewhat depending on the data available. Using asset return data as available through 2009 for a variety of assets and asset classes (for example, 1926-2009 for individual U.S. stocks), they find that:
- Within each asset class, alphas and Sharpe ratios decline systematically with beta.
- Market-neutral, betting-against-beta portfolios generate significant risk-adjusted returns for all asset classes. Specifically:
- During 1926-2009, the betting-against-beta portfolio for U.S. stocks generates average monthly gross alphas of 0.69% for three-factor (market, size, book-to-market) adjustment, 0.55% for four-factor (adding momentum) adjustment and 0.46% for five-factor (adding liquidity) adjustment. The corresponding annualized Sharpe ratio is 0.75, about twice that of the value premium and 40% higher than that of the momentum effect. (See the chart below.)
- Results for betting-against-beta stock portfolios within non-U.S. equity markets during 1984-2009 are similar.
- During 1952-2009, the betting-against-beta portfolio for U.S. Treasuries generates an average abnormal monthly gross return of 0.16%, with annualized Sharpe ratio 0.85.
- A betting-against-beta portfolio for U.S. corporate bonds generates an average abnormal monthly gross return of 0.13%, with annualized Sharpe ratio 0.88.
- For country equity indexes, country bond indexes, foreign exchange and commodity futures, betting-against-beta portfolios generate annualized Sharpe ratios ranging from 0.22 to 0.51.
- When credit tightens (high TED spread), beta distributions compress towards one, and returns of betting-against-beat portfolios decrease. Both a low TED spread and a high beta dispersion predict relatively high betting-against-beta portfolio returns.
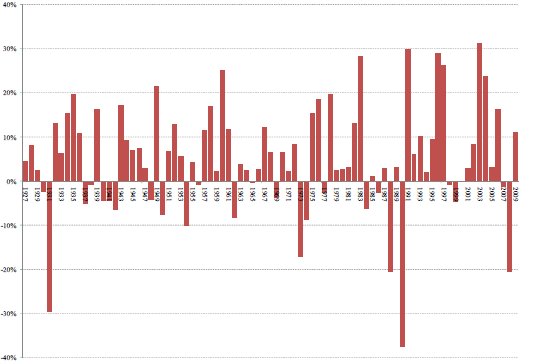
The following chart, taken from the paper, shows annualized gross four-factor (market, size, book-to-market, momentum) abnormal returns during 1927-2009 for a betting-against-beta portfolio of U.S. stocks. This market-neutral portfolio is long low-beta stocks (leveraged up to an aggregate beta of one) and short high-beta stocks (de-leveraged to an aggregate beta of one), reformed monthly. On average, this portfolio is 152% long low-beta stocks and 71% short high-beta stocks. The abnormal return is positive in 58 of 83 years.
The paper includes similar charts for other asset classes.

All return calculations in the paper appear to be frictionless. Including realistic trading frictions and costs of leverage would reduce the alphas and Sharpe ratios presented. Also, to the extent that any calculations rely on returns for indexes rather than tradable assets, costs of forming tradable assets would further reduce alphas.
In summary, evidence within and across asset classes indicates that leverage-inhibited investors tend to bid up prices of high-beta assets as an alternative means of achieving leverage. Investors may be able to exploit this relative overpricing of high-beta assets.
Leveraged exchange-traded funds may present acute opportunities for such exploitation.