The market rewards investors for taking risk. Right? High volatility means high risk. Right? High volatility therefore means excess return. Right? In their January 2006 paper entitled “High Idiosyncratic Volatility and Low Returns: International and Further U.S. Evidence”, Andrew Ang, Robert Hodrick, Yuhang Xing and Xiaoyan Zhang test the relationship between past idiosyncratic volatility and future returns for stocks in developed markets around the world. Using data from 23 countries mostly over the period January 1980 through December 2003, they find that:
- Stocks with high recent idiosyncratic volatility have relatively low future returns around the world. The difference in average monthly returns between top quintile and bottom quintile value-weighted international portfolios sorted on idiosyncratic volatility and rebalanced monthly is a risk-adjusted -1.31%.
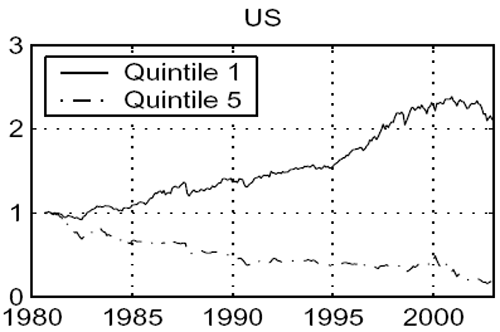
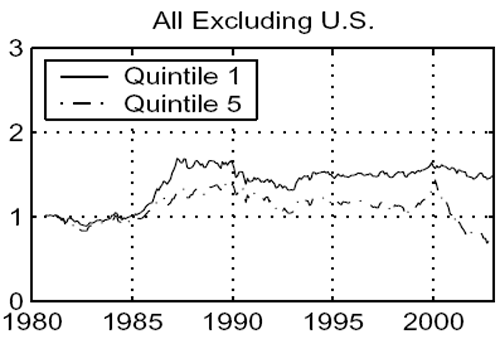
- The economic effect is stronger in the U.S. because the range of idiosyncratic volatility is larger for U.S. stocks than for stocks in other countries.
- Over the period August 1963 through December 2003, value-weighted portfolios of U.S. stocks with high recent idiosyncratic volatilities show significantly lower returns than portfolios with low recent idiosyncratic volatilities (again rebalancing monthly) . This difference is tradable and persists across a wide range of conditions. In contrast, the weaker volatility effect outside the U.S. is likely not tradable.
- Unlike most anomalies, this volatility effect is stronger for large companies than for small ones.
The following charts, extracted from the paper, graph the cumulative values of two value-weighted portfolios that start with $1 invested at the beginning of January 1980 in: (1) stocks with the lowest idiosyncratic volatilities over the previous month (Quintile 1); and, (2) stocks with the highest idiosyncratic volatilities over the previous month (Quintile 5). The authors rebalance both portfolios monthly through December 2003. The authors construct the non-U.S. quintile portfolios as value-weighted sums of country quintile portfolios, expressed in U.S. dollars. The charts demonstrate that the volatility effect is much greater in the U.S. than elsewhere in the world.


In summary, evidence indicates that exceptionally volatile stocks tend to underperform exceptionally stable stocks.
Cautions regarding findings include:
- Reported returns are gross, not net. Incorporating reasonable trading frictions would materially reduce these returns.
- Data collection and processing burdens to support monthly portfolio reformation are substantial, or potentially costly if delegated. The methodology apparently allows no lag between monthly calculations and trading.