Do prices exhibit persistently exploitable trends across asset classes all the time? In their April 2014 paper entitled “Two Centuries of Trend Following”, Y. Lemperiere, C. Deremble, P. Seager, M. Potters and J. P. Bouchaud examine risk-adjusted performance of a trend following strategy across four asset classes (commodities, currencies, stock indexes, bonds) over very long sample periods. They generate trend signals for an asset based on the difference between current monthly closing price and the exponential moving average (EMA) of past monthly closing prices (excluding current price) with a decay rate n months, divided (normalized) by volatility as measured by the EMA of absolute monthly price changes also with decay rate n months. They use a baseline EMA decay rate of five months, but test of findings to other values. They define the trend strength as the statistical significance of gross profit from a hypothetical strategy that buys (sells) a quantity of the asset scaled by the inverse of the volatility when the signal is positive (negative). Their measure of statistical significance is annualized return divided by annualized volatility multiplied by the square root of the number of years the strategy is active. They ignore trading frictions. Using monthly closing futures contract prices as available since 1960 (seven stock indexes, seven 10-year bonds and six currency exchange rates for developed economies and seven commodity series) and spot prices for these assets as available since 1800, they find that:
- For the test on 27 futures contract price series as available since 1960:
- Aggregate gross trend following performance is strong for EMA decay rate five months.
- Correlation with an aggregate long-only position is only 0.15 for EMA decay rate five months, such that results remain strong after adjustment for series price drifts.
- Results hold for all asset classes and in all decades for EMA decay rate five months.
- Results hold across different EMA decay rates, with three months near optimal (gross annualized return/volatility ratio 0.83).
- The relationship between signal strength and future returns suggests saturation (above a certain level, strength of signal does not matter).
- For the test on spot price series as available since 1800 for EMA decay rate five month:
- Aggregate gross trend following performance is strong (gross annualized return/volatility ratio 0.72).
- Results hold for all asset classes.
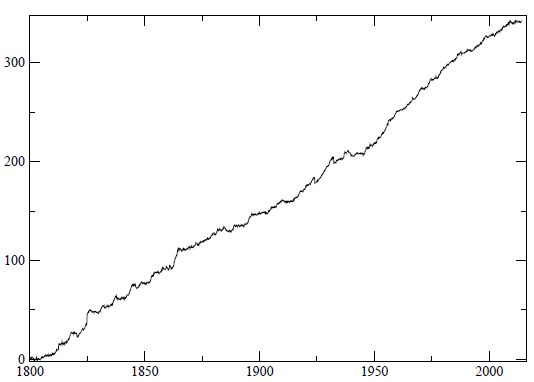
- Performance is steady over time, significant in all 50-year subperiods and positive in every decade (see the chart below). In other words, results suggest that strong growth in assets managed by Commodity Trading Advisors have not substantially affected the strength of financial market trends.
- The poor very recent performance of trend following in futures is explicable as a statistical fluctuation (not necessarily market adaptation to overcrowded trading).
The following chart, taken from the paper, tracks gross aggregate cumulative performance (growth of a $1 initial investment) for the trend-following strategy specified above (EMA decay rate five months) as applied to spot prices for stock indexes, bonds, currency exchange rates and commodities as available since 1800. The gross annualized return/volatility ratio over the entire sample period is 0.72. Performance is fairly steady over the entire sample period, with only occasional episodes of weakness (as in very recent data).
In summary, evidence indicates that following up and down price trends via volatility-scaled long and short positions as specified by EMA crossing signals persistently generates attractive gross volatility-adjusted performance across asset classes over long samples.
Cautions regarding findings include:
- As noted, reported performance is gross, not net. Findings based on net performance may differ from those based on gross performance. In particular, estimation of trading frictions is very difficult for long series of spot prices. These frictions may be very high for large parts of sample periods, swamping gross performance of trend following.
- For long-term spot prices, the study excludes episodes such as: bond prices before 1918 (as not liquid); war-time and post-war bond prices in Germany and Japan (as distorted); stock indexes during World War II in Germany and Japan (due to market closures); and, crude oil during part of the second half of the 20th century (due to price fixing). It is arguable that the authors thus exclude data that may conflict with an assumption of tame return distributions implicit in the measure of statistical strength. Practically, trend followers may have suffered large losses due to such episodes.