Is firm profitability trend, or momentum, a useful indicator of future stock returns? In their December 2014 paper entitled “The Trend in Firm Profitability and the Cross Section of Stock Returns”, Ferhat Akbas, Chao Jiang and Paul Koch investigate the relationship between trend in firm profitability and stock returns, while controlling for level of profitability. They calculate gross profit quarterly as sales minus cost of goods sold, divided by total assets. They specify level of profitability as average gross profit over the past eight quarters. They specify trend in profitability as linear slope over the past eight quarters. They employ assumptions that ensure public availability of all data at the time of measurement, including a skip-month between portfolio formation and holding period. Using firm characteristics and returns for a broad sample of U.S. common stocks during January 1977 through December 2012, they find that:
- Across all firms, the average level of profitability is 10%. The average trend in profitability is close to zero, ranging from about -2.2% to +2.9% per quarter. The average correlation between level of and trend in profitability is slightly negative.
- Profitability trend predicts gross stock returns. A hedge portfolio that is each month long (short) the tenth of stocks with the highest (lowest) profitability trends generates an average gross next-month return of 0.83%.
- For large (small) stocks, hedge portfolio average gross monthly return is 0.34% (0.89%).
- Hedge portfolio gross three-factor (market, size, book-to-market) monthly alpha is 0.85%, and gross four-factor (adding momentum) alpha is 0.64%.
- The predictive power of profitability trend is incremental to that of profitability level. Hedge portfolios formed monthly from double-sorts on these two variables indicate that:
- Controlling for profitability trend, stocks with high profitability levels outperform those with low profitability levels by an average gross 0.38% to 0.73% per month.
- Controlling for profitability level, stocks with high profitability trends outperform those with low profitability trends by an average gross 0.50% to 0.85% per month.
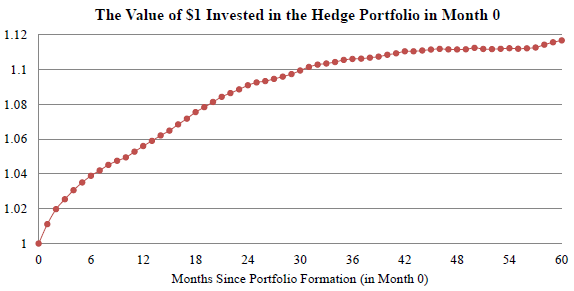
- Profitability trend predicts stock returns over the next eight quarters (see the chart below), and there is no subsequent return reversal over the ensuing three years. In other words, the effect is permanent.
- The profitability trend effect persists after controlling for size, book-to-market ratio, medium-term past return, long-term past return, return volatility, volatility of profitability, earnings momentum, turnover, liquidity, asset growth, accruals, distress risk, firm strength, research and development expenditures, persistence or streaks in earnings, measures of investor sentiment and alternative measures of profitability.
The following chart, taken from the paper, shows the average cumulative value over 60 months of an initial investment of $1 in a hedge portfolio that is long (short) the tenth of stocks with the highest (lowest) profitability trends. This buy-and-hold portfolio (different from the monthly portfolio reformation in the calculations above) appreciates by an average of nearly 12% over the five years after portfolio formation. Results indicate that the portfolio generates most of its return during the 24 months after formation and experiences no long-term reversal.
In summary, evidence indicates that profitability momentum may be a useful indicator of future stock returns, separately from level of profitability.
Cautions regarding findings include:
- Reported portfolio performance is gross, not net. Including trading frictions for monthly hedge portfolio reformation and shorting costs would reduce performance. Also:
- Some stocks may not be available for shorting as assumed.
- The relatively stronger profitability trend effect among small stocks suggests that liquidity may be an obstacle to capturing it.
- Costs of data collection/processing burden (or fee if delegated to a fund manager) would also reduce performance.