A reader requested a review of the trading advisory service offered at StocksandBulls.com. The FAQs there state that the site “contains the information that is required to successfully trade the stock market on a regular basis with our ‘home growned’ robust trading system. From recommended buy and sell signals, all generated one day in advance to showing the end results, all is posted in total transparency.” The FAQs further state that the methodology used is “capable of detecting logical and profitable buy and sell signals quite accurately on stocks, without any guesswork left for users to do.” Using the trading record on site from inception on 2/13/06 through 12/14/09, we find that:
Summary statistics for the trades listed on StocksandBulls.com over the sample period are:
- There are 180 purchases and 151 sales (leaving 29 open positions).
- The percentage of the 151 closed trades that are profitable, excluding trading frictions, is 79.5%. The status of open trades (marked to market) is unknown.
- The average profit per closed trade is based on recommended (reported) purchase price is 3.8% (4.1%). The return on open trades (marked to market) is unknown.
- The average duration of closed trades is 20 calendar days. The average age of open trades (as of 12/14/09) is 20 days.
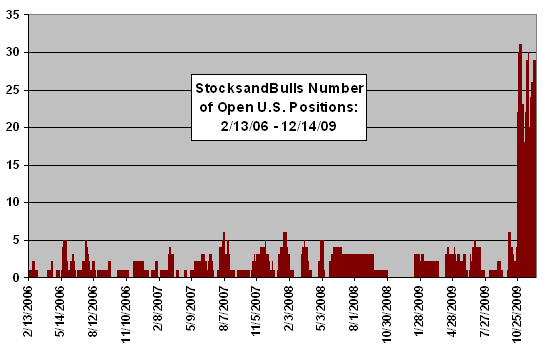
- The average number of open positions on a daily basis is 2.5, but there is a dramatic increase in open positions in late October 2009. Prior to (After) 10/25/09, the average number of open positions per day is 1.7 (25.2).
- The maximum number of open positions prior to (after) 10/25/09 is 6 (31).
Determining whether these metrics represent an attractive trading system requires assumptions about portfolio management. StocksandBulls.com makes the following recommendation:
“Q: Do you have any recommendation on how I should manage my capital?
A: It varies greatly according to an investor’s style and the size of the capital. Simply, we recommend to buy as much stocks that are posted for the country of your choice simply to diversify. No one or two down trades should be able to take away a sizable amount from the capital.”
The following chart summarizes the number of StocksandBulls.com recommended open positions over time. As noted above, there is apparently some change in methodology in late October 2009 that generates a much larger number of open positions. However, StocksandBulls.com makes the following statement about methodology changes:
“Q: Do you modify your trading system now and then?
A: No. Not even a little. Although market conditions do change, the system interprets those changes. The results are consistent and profitable.”
The large jump in open positions is apparently, therefore, due to a change in market conditions in late October 2009.
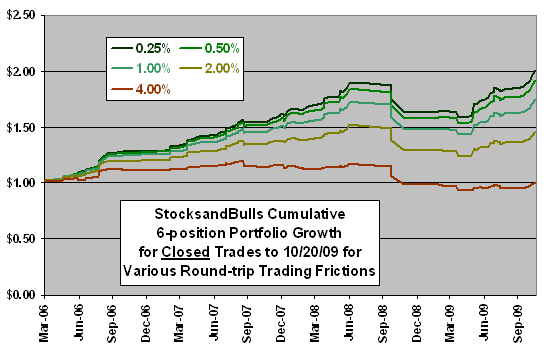
In retrospect, the trading system does not support a fully invested, diversified portfolio over most of its history. One way to test the system at a portfolio level is to assume a maximum of six roughly equal positions over the subperiod 2/13/06 through 10/25/09. This assumption exploits all recommendations during that subperiod. Under this assumption, since there are only 1.7 open positions per day on average, the portfolio has a daily average cash level of about 72%.
How does this assumption translate to cumulative returns over the subperiod?

The next chart shows the cumulative value of $1 initial investments in StocksandBulls.com recommendations for a 6-position portfolio with a range of round-trip trading frictions over the subperiod 2/13/06-10/25/09. Round-trip trading frictions range from 0.25% to 4% of trade size. Calculations assume that each trade affects one-sixth of portfolio value. For reasonably large portfolios, assuming trades are executed as limit orders per exact instructions (no bid-ask spread penalty), the smaller trading frictions may be realistic. For very small portfolios, the larger trading frictions may be realistic. Results indicate that portfolio-level returns are attractive for reasonably large portfolios.
However, the cumulative values in the chart do not include the effects of marking open positions to current market values. These effects may reduce the cumulative returns shown and inflate the win rate. Also, cumulative returns that exclude open positions are not readily comparable to an index benchmark.
After 10/25/09, the assumption of a 6-position portfolio may produce different results. The much larger number of recommendations after that date means quickly taking six positions and skipping subsequent recommendations until one of the six taken positions closes. For example, a StocksandBulls.com trader with a 6-position portfolio strategy would be “stuck” as of 12/14/09 in two open positions taken 11/16/09, one open position taken 11/17/09 and three open positions taken 11/27/09. Because, as shown below, bad trades last longer than good ones, there may be a tendency for such a strategy to carry a material, negative marked-to-market bow wave.
What is the relationship between trade return and trade duration?

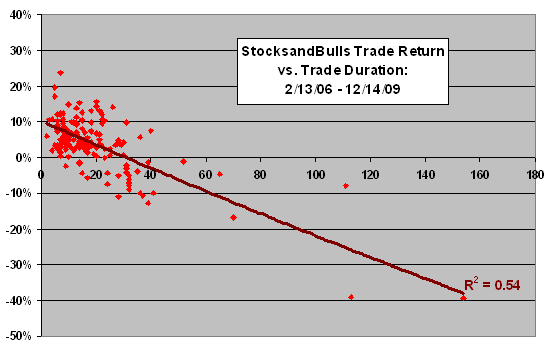
The final chart relates gross return per trade to trade duration for all closed trades. The slope of the best-fit line is negative, indicating that bad trades tend to last longer than good ones. The R-squared statistic is 0.54, indicating that variation in trade duration explains 54% of the variation in trade return. As noted above, an implementation that limits the number of portfolio positions to a relatively small number may tend to get stuck in bad, longer-lived trades. The alternative would be to increase the number of portfolio holdings, but such an increase would tend to elevate average portfolio cash level and increase trading friction as a percentage of trade size.

The above analyses assume that the trade data on StocksandBulls.com is accurate and complete as presented.
Note that the “total transparency” offered on the site apparently does not extend to the name of the individual(s) or company that owns and operates StocksandBulls.com. A domain lookup indicates that the owner created the domain name on 9/13/06 (seven months after the start of the trading history), but ownership is opaque via Domains by Proxy. This opacity may be of special concern with respect to subscriber recourse per the following statement in the site disclaimer: “This information is given as of the date appearing on the StocksandBulls.com web site report or email, and StocksandBulls.com assumes no obligation to update the information or advice on further developments relating to any named securities.”
In summary, the StocksandBulls.com trading advisory service may offer an edge to traders with reasonably large accounts. However, a recent large increase in the number of recommended positions, a tendency to hold losers longer than winners and anonymity of the offeror are cautions.