Does availability of liquid tracking products change short-term trending/reversal tendencies of equity indexes? In their May 2016 paper entitled “Indexing and Stock Market Serial Dependence Around the World”, Guido Baltussen, Sjoerd van Bekkum and Zhi Da investigate how introduction of index futures, exchange-traded funds (ETF) and mutual funds affects measures of index serial dependence. They hypothesize that technical interplay in index products among investors, market makers and arbitrageurs stimulates short-term reversal. They measure serial dependence with daily lags and one-week lag in two ways: (1) simple autocorrelations; and, (2) returns to a “MAC(5)” trading strategy based on a weighted average of autocorrelations for lags 1 to 4, with positive (negative) returns indicating trending (reversal). Using daily data for 21 major global equity indexes and associated index futures and ETFs and for mutual funds tracking the S&P 500 Index as available through mid-May 2013, they find that:
- The value of products tracking the S&P 500 Index rises to about 7% of index market capitalization over the sample period. Across all 21 indexes, tracking products represent less than 0.5% (about 3%) of pre-1990s (post-2010) aggregate index capitalization.
- Serial dependence switches from positive to negative as the value of index-tracking products grows, with 1-day lagged autocorrelation aggregated across indexes:
- +0.012 over the full sample.
- +0.038 before introduction of index futures.
- -0.005 after introduction of index futures
- -0.040 during the last five years of the sample.
- For 2-day through 5-day lagged autocorrelations aggregated across indexes, no (three of four) lags are negative before (after) introduction of index futures.
- 1-week lagged autocorrelations are:
- Negative for 6 of 21 (21 of 21) individual indexes before (after) introduction of respective index futures.
- 0.026 (-0.087) for the S&P 500 Index before (after) introduction of index futures.
- Returns to the MAC(5) trading strategy (see the chart below):
- When applied to the indexes themselves, reverse from positive to negative after introduction of index futures.
- Are negative when applied to both index futures and index-tracking ETFs.
- Based on linear modeling of the relationship between level of indexing and MAC(5):
- A 1% increase in level of indexing reduces serial dependence by 0.038.
- The level-of-indexing tipping point for positive==>negative serial dependence is about 1%.
- Results suggest that short-term traders should focus on index reversal (liquidity provision) rather than trend-following.
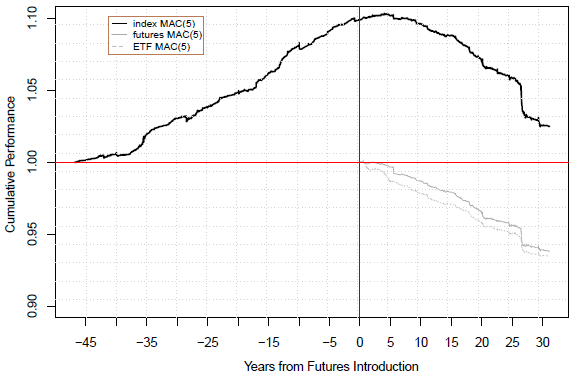
The following chart, taken from the paper, plots cumulative returns to MAC(5) trading strategy applied to three sets of time series:
- index MAC(5) (solid black line) – equally weighted returns from applying the strategy to the 21 stock indexes relative to index futures introduction date (time 0).
- futures MAC(5) (solid gray line) – equally weighted returns from applying the strategy to futures for the 21 stock indexes.
- ETF MAC(5) (dashed light gray line) – equally weighted returns from applying the strategy to tracking ETFs for the 21 stock indexes.
Prior to futures introduction, returns for index MAC(5) are generally positive. After futures introduction, returns on indexes turn negative. Returns on futures MAC(5) and ETF MAC(5) are consistently negative. In other words, equity indexes and products tracking them all display negative serial dependence at daily to weekly frequencies over the last 15 years.
In summary, evidence indicates that serial dependence in daily to weekly equity index (and index product) returns is significantly negative in recent decades, suggesting focus on short-term reversal rather than trend-following strategies.
Cautions regarding findings include:
- The authors assert in the paper that MAC(5) returns are “economically significant even after accounting for transaction costs… For example, the (unreported) absolute Sharpe ratio for futures MAC(5) equals 0.4, and break-even single-trip transaction cost levels are 11bp, on average, well above realistic levels of actual costs.” However, support for these assertions is scant.
- Tests generally assume linearity in relationships and tameness (near normality) of daily/weekly return for equity indexes and associated products. Any wildness in these series may disrupt exploitation.