Is there an easy way for investors to capture jointly the most reliable stock return factor premiums? In their March 2018 paper entitled “The Conservative Formula: Quantitative Investing Made Easy”, Pim van Vliet and David Blitz propose a stock selection strategy based on low return volatility, high net payout yield and strong price momentum. Specifically, at the end of each quarter they:
- Segment the then-current 1,000 largest stocks into 500 with the lowest and 500 with the highest 36-month return volatilities.
- Within each segment, rank stocks based on total net payout yield (NPY), calculated as dividend yield minus change in shares outstanding divided by its 24-month moving average.
- Within each segment, rank stocks based on return from 12 months ago to one month ago (with the skip-month intended to avoid return reversals).
- Within the low-volatility segment, average the momentum and NPY ranks for each stock and equally weight the top 100 to reform the Conservative Formula portfolio.
- Within the high-volatility segment, average the momentum and NPY ranks for each stock and equally weight the bottom 100 to reform the Speculative Formula portfolio.
Limiting the stock universe to the top 1,000 based on market capitalization suppresses liquidity risk. Limiting screening parameters to three intensely studied factors that require no accounting data mitigates data snooping and data availability risks. They focus on the 1,000 largest U.S. stocks to test a long sample, but also consider the next 1,000 U.S. stocks (mid-caps) and the 1,000 largest stocks from each of Europe, Japan and emerging markets. They further examine: (1) sensitivity to economic conditions doe the long U.S. sample; and, (2) impact of trading frictions in the range 0.1%-0.3% for developed markets and 0.2%-0.6% for emerging markets. Using quarterly prices, dividends and shares outstanding for the contemporaneously largest 1,000 U.S. stocks since 1926, European and Japanese stocks since 1986 and emerging markets stocks since 1991, all through 2016, they find that:
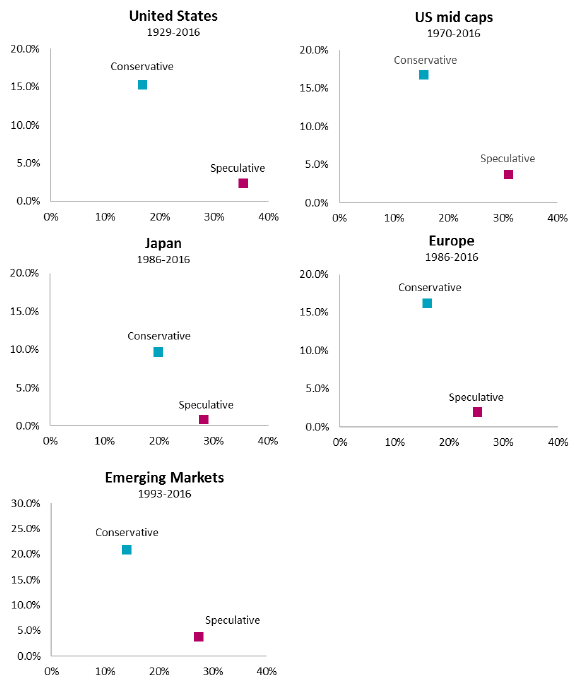
- For each sample, the Conservative Formula portfolio generates much higher gross compound annual growth rate (CAGR) with much lower risk than the Speculative Formula portfolio (see the first chart below).
- Gross CAGR differences are 8.8% for Japan, 13% for the U.S., 14% for Europe and 17.2% for emerging markets.
- Risk reductions are 35% for Europe and Japan and 50% for the U.S. and emerging markets.
- For the long U.S. sample, the Conservative Formula portfolio has:
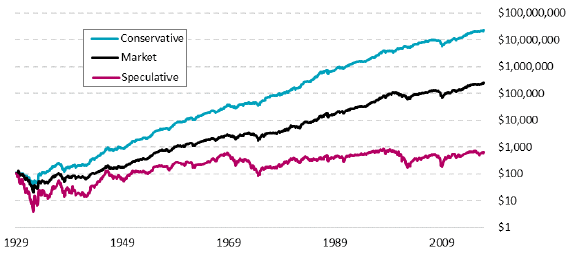
- Gross CAGR 15.1%, compared to 9.3% for the broad value-weighted stock market and just 2.1% for the Speculative Formula portfolio (see the second chart below).
- Gross average annual return over 8% during each decade and higher than the average market return for eight of nine decades.
- Gross return similar to strategies based on size, value, momentum and net payout yield individually, but with markedly lower risk. Gross annual Sharpe ratio for the Conservative Formula portfolio is 0.94, compared to 0.57 for the value-weighted market and 0.50, 0.53, 0.71, 0.80 and 0.78 for portfolios similarly constructed based on individual small, value, momentum, low volatility and NPY factors, respectively.
- Positive exposures to the most profitable factor premiums, beating all combinations of strategies based on size, quality, value and momentum.
- Overall 1-factor (market) gross annual alpha 6.2% that is consistent across economic conditions (NBER economic expansions versus contractions), long-term interest rate regimes (though stronger for falling than rising rates) and credit spread regimes.
- Conservative Formula portfolio turnovers are about 30% per quarter across samples, translating to an average stock holding period of slightly less than a year. For the higher assumed levels of trading frictions, net average annual returns are 14.5%, 15.4%, 8.9% and 19.5% for the U.S., Europe, Japan and emerging markets, respectively.
The following charts, taken from the paper, plot gross CAGR (vertical axis) versus volatility (horizontal axis) for the Conservative Formula portfolio (blue) and the Speculative Formula portfolio (red) within each sample. Conservative Formula portfolios consistently generate much higher gross CAGRs with much lower volatilities than respective Speculative Formula portfolios.
The next chart, also from the paper, compares on a logarithmic scale cumulative performances of $100 initial investments in the Conservative Formula portfolio, the value-weighted market and the Speculative Formula portfolio for the long U.S. stock sample. Results show that the Conservative (Speculative) Formula portfolio steadily and smoothly outperforms (steadily and erratically underperforms) the market on a gross basis.
In summary, evidence indicates that the Conservative Formula offers strong and steady portfolio performance via a reasonably simple way to capture several of the most widely accepted stock factor premiums.
Cautions regarding findings include:
- The assumed levels of trading frictions may be too low (see, for example, “Trading Frictions Over the Long Run”).
- 100 stocks is too many for most individual investor portfolios, and data collection and processing tasks are beyond their reach. Such investors would bear fees for accessing such a portfolio via a fund.
- Relative short average stock holding periods may mean substantial tax burdens in accounts without tax deferral.
- The authors assert that the “limited number of simple factors…reduces the risk of ‘p-hacking‘” or data snooping, impounded in the Conservative Formula, and that they “further reduce the risk of ‘p-hacking’ by only using market data.” However, considerable in-sample stock return factor research by others informs construction of the formula, such that there is arguably material inherited snooping bias and therefore overstatement of expectations in historical Conservative Formula portfolio performance.