A reader suggested a review of the stock market commentary of Mark Hulbert, editor of the Hulbert Financial Digest, which tracks the recommendations of a wide range of investing newsletters. He is also a regular columnist at MarketWatch. Because Mark Hulbert uses his Hulbert Stock Newsletter Sentiment Index (HSNSI) as a principal quantitative tool in formulating his market outlook, we evaluate the usefulness of that index in predicting stock market returns rather than his qualitative commentary. HSNSI “reflects the average recommended stock market exposure among a subset of short-term market timers tracked by the Hulbert Financial Digest.” Mark Hulbert presents HSNSI as a contrarian signal for future stock returns; when HSNSI is high (low), he views the outlook for stocks as materially bearish (bullish). Using a sample of 287 values of HSNSI over the period July 2002 through September 2013 (generated by searching MarketWatch.com for “HSNSI” and its predecessor “HSSI”) and contemporaneous daily closes of the S&P 500 Index, we find that:
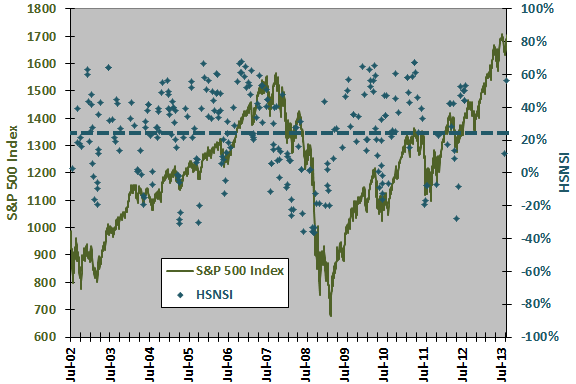
The average value of HSNSI for the sample is 24.4%, with standard deviation 26.1% (high volatility). The high for the sample is 67.8% (on 11/20/06), and the low is -36.1% (end of September 2008). Assuming normal variable distributions, the sample is large enough to test predictive power with reasonable reliability for short-term stock returns (a few trading days or weeks), but is not large enough to test HSNSI reliably as a long-term stock market indicator. The sample may be biased due to selection and clustering, because Mark Hulbert may be more likely to cite HSNSI, and cite it frequently, when either HSNSI or stock market behavior is extreme.
The following chart superimposes the HSNSI sample on a plot of the S&P 500 Index. The blue dashed line is the average HSNSI for the sample. As noted, HSNSI has high variability. Visual inspection suggests that HSNSI, like many other sentiment indicators, tends to be high (low) during market advances (declines). It is difficult to discern whether HSNSI reliably leads the stock market.
For precision, we relate HSNSI to future S&P 500 Index returns.
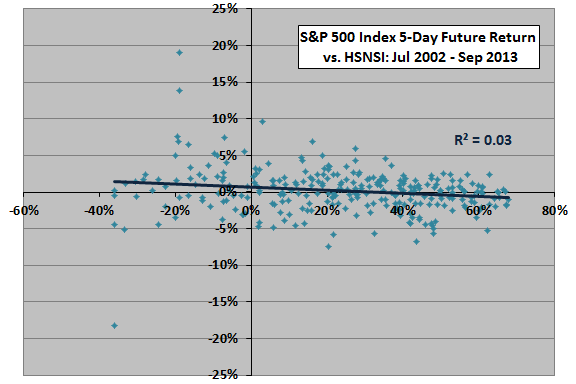
The following scatter plot relates the return on the S&P 500 Index over the next 5 trading days to HSNSI over the entire sample period. The Pearson correlation for the two series is -0.17, indicating some tendency for the stock market to be relatively weak (strong) when HSNSI is high (low). The R-squared statistic is 0.03, indicating that variation in HSNSI explains just 3% of the variation in stock market returns over the next week.
Using future return intervals of 21 (63) trading days yields an R-squared statistic of 0.01 (0.02), indicating that variation in HSNSI explains just 1% (2%) of the variation in future monthly (quarterly) stock market returns, again with negative slope.
Note that the sample may have some selection/clustering biases at this point. Clustering leads to some overlap of future return intervals, overstating sample size and perhaps overweighting extreme stock market returns. From a practical perspective, clustering confounds a trading rule that specifies entry/exit based on values of HSNSI. What happens if we remove clustering?
To eliminate measurement interval overlap and alleviate clustering bias, we winnow sample points so that no two surviving points lie within the same return interval.
The next chart depicts the relationship between the return on the S&P 500 Index over the next 5 trading days to HSNSI for a winnowed sample (202 surviving sample points), ordered from lowest to highest HSNSI. Ordering helps determine whether some ranges of HSNSI might be more useful than others. Note that the horizontal axis counts the signals but is not time-sequential. The Pearson correlation between the two series is -0.21, again indicating some tendency for the stock market to be relatively weak (strong) when HSNSI is high (low). The R-squared statistic indicates that variation in HSNSI explains about 5% of the variation in stock market returns over the next week.
Much of the explanatory power of HSNSI at a 5-day horizon comes from the large peak at the left side (two observations from October and November 2008). This substantial impact from exclusion of just two observations suggests that the sample is small for reliable inference.
Using future return intervals of 21 and 63 trading days on appropriately winnowed samples yields R-squared statistics of 0.06 and 0.02 (with negative correlation), respectively, for the relationship between HSNSI and future stock market returns at monthly and quarterly horizons. Winnowed sample sizes are only 82 and 37, respectively, so these results have limited reliability.
For a different perspective that does not assume linearity in the relationship, we evaluate future stock market returns by winnowed terciles (ranked thirds) of HSNSI values.

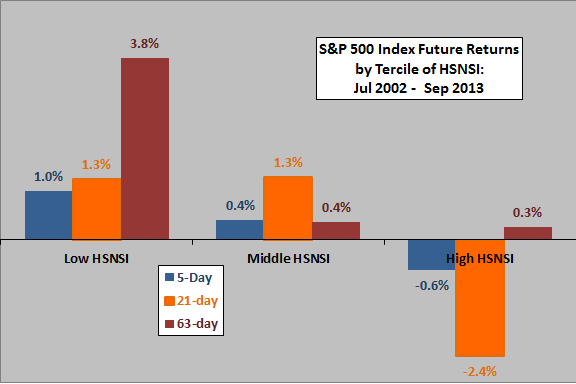
The final chart summarizes average S&P 500 Index returns over the next 5, 21 and 63 trading days by tercile (ordered third) of the winnowed HSNSI distributions for the entire sample period. Average returns for all intervals of 5, 21 and 63 trading days during the sample period are 0.2%, 0.6% and 1.8%, respectively.
Results offer some support for a belief that high (low) values of HSNSI indicate relatively low (high) future stock market returns. However, the relationship is systematic across terciles only for the 5-day return horizon. For the 5-day horizon, “low NSNSI” means below about 16% and “high HSNSI” means above about 40%.
Note that the terciles for the 21-day and 63-day future returns are very small, 28 and 13, respectively. One or two new observations could change results for these intervals substantially. Note also that this perspective is in-sample, and an investor operating in real time on purely historical data may have selected different thresholds for segmentation.
HSNSI is, in fact, more strongly related to past than future stock returns. Pearson correlations between HSNSI and S&P 500 Index returns over the past 5, 21 and 63 trading days (unwinnowed) are 0.37, 0.62 and 0.67, respectively. When the stock market advances (declines), HSNSI tends to rise (fall). For returns over the future 5, 21 and 63 trading days (unwinnowed), correlations are -0.17, -0.09 and -0.12, respectively. In other words, it is much easier to predict the future value of HSNSI based on past stock returns than it is to predict future stock returns based on the value of HSNSI. These results suggest that predictive power exhibited by HSNSI may derive from return reversion and not from the sentiment of newsletter writers. Correlations between S&P 500 Index return over the past 10 trading days and returns over the next 5, 21 and 63 trading days are -0.13, -0.07 and -0.05, respectively.
In summary, evidence from simple tests indicate that, while results are mixed, the Hulbert Stock Newsletter Sentiment Index may have a little power to predict future stock market returns over near-term horizons.
Cautions regarding these findings include:
- As noted above, given the variability of returns, sample and subsample sizes are often small for reliable inference.
- The testing approach used above is in-sample. An investor operating in real time would not know all the data. A realistic scenario would require: (1) a continuous sample of HSNSI over an extended period; (2) a real trading vehicle with frictions; and, (3) a trading rule based solely on HSNSI thresholds derived only from historical values known to date.
- The study described in “Purifying Stock Market Sentiment Indicators” finds that poll-based sentiment indicators, including HSNSI, are proxies for past stock market behavior and that they add little or no value to indicators based purely on historical price metrics.
See below for Mark Hulbert’s comments on a prior iteration of this analysis.
On 10/31/08, Mark Hulbert wrote:
Thanks for your rigorous analysis of the Hulbert Stock Newsletter Sentiment Index. I am sorry you had such limited data with which to conduct your analysis, which — as you conceded — greatly reduces the potential power of any test results. We have found–using our data set back to 1985, and correcting for various statistical biases, including the ones you mention–markedly greater statistical significance than you found from your more limited sample.
Response:
The sample used derives from the nearly [now well over] 200 mentions of the Hulbert Stock Newsletter Sentiment Index in MarketWatch columns over the past 6+ [now 9+] years. It may be that there is some skew in the published data, or that the predictive power of the index varies over time (and has diminished). If you have made public your study of the index, we will be glad to cite it. Or, if you make public the complete dataset, we will be glad to run analyses on the complete set, as well as subsets to test robustness over time.