Do low-volatility stocks outperform high-volatility stocks around the globe? In their October 2012 paper entitled “Stock Return Volatility, Operating Performance and Stock Returns: International Evidence on Drivers of the ‘Low Volatility’ Anomaly”, Tanuj Dutt and Mark Humphery-Jenner investigate links among stock return volatility, stock returns and firm operating performance in emerging and developed markets outside North America. They focus on a 500-day moving variance of daily stock returns as a measure of volatility, but also consider 90-day, 180-day, 250-day and 1000-day alternatives. They assign stocks based on listing exchange to one of four market groups: Emerging Asia, Emerging EMEA, Latin America and Ex-U.S./Canada Developed. For each group each month, they rank stocks into quintiles (fifths) by return volatility and track value-weighted and equal-weighted average quintile returns for the balance of the month. Using daily prices for a broad sample of international stocks (excluding the smallest and least liquid, but still capturing over 90% of market capitalization) and associated firm operating performance data during 1990 through 2009, they find that:
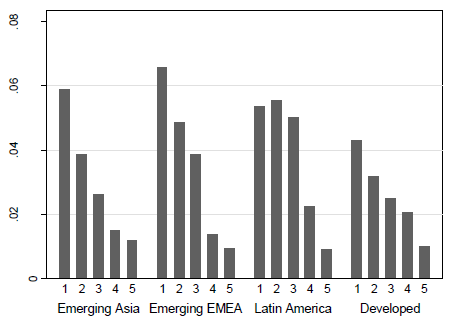
- On average, based on gross returns, stocks in the lowest volatility quintile outperform those in other quintiles in developed markets and in emerging markets across all regions outside of North America (see the chart below).
- Firms with low-volatility stocks exhibit higher past and future operating performance than those with high-volatility stocks.
- Results hold for both value-weighted and equal-weighted portfolios. Results are robust to: removing the least liquid tenth of stocks from the sample; and, controlling for the proportion of days that a stock has zero return (as a proxy for trading costs). Results are qualitatively robust to the length of the stock volatility measurement interval.
The following chart, taken from the paper, summarizes average gross annualized returns in each market group by value-weighted volatility quintile (from lowest=1 to highest=5), reformed at the beginning of each month over the sample period. Low-volatility stocks substantially outperform high-volatility stocks in all four groups.

In summary, evidence indicates that low-volatility stocks outperform high-volatility stocks pervasively outside North America over the long run.
Cautions regarding findings include:
- Reported returns are gross, not net. Including reasonable trading frictions associated with monthly quintile turnover would reduce these returns. While long volatility measurement intervals likely generate modest turnover, trading frictions may be relatively high in emerging markets.
- Given the relatively long durations and consequent monthly overlaps of stock volatility measurement intervals (as long as four years), the sample period is not long.
For closely related research, see “Pervasive Outperformance of Low-volatility Stocks”, “Reward for Risk in Emerging Equity Markets?” and “Low Risk and High Return?”.