
Do country economic fundamentals provide exploitable information about future changes in associated currency exchange rates? In the June 2013 version of their paper entitled “Currency Risk Premia and Macro Fundamentals”, Lukas Menkhoff, Lucio Sarno, Maik Schmeling and Andreas Schrimpf investigate the usefulness of economic fundamentals in currency trading by measuring the performance of multi-currency hedge portfolios formed by sorting on lagged economic variables across 35 countries. They take the perspective of a U.S. investor by measuring all exchange rates versus the U.S. dollar. The country economic variables they consider are: (1) interest rates; real Gross Domestic Product (GDP) growth; real money growth (from currency in circulation); and, real exchange rates. They calculate growth rates based on 20-quarter rolling averages. They form hedge portfolios from extreme fourths (quartiles) of ranked currencies, rebalanced annually at year end, and calculate returns in excess of short-term interest rates. Using quarterly currency exchange rate, short-term interest rate, real GDP, Consumer Price Index (CPI) and currency in circulation for 35 countries/currencies for out-of-sample testing from the first quarter of 1974 through the third quarter of 2010, they find that:
- Economic fundamentals substantially predict currency exchange rates, with unlevered hedge portfolios generating gross average annualized returns in excess of short-term interest rates of up to 6%.
- The carry trade portfolio, long (short) the fourth of currencies with the highest (lowest) interest rates generates a gross annualized average excess return of about 6% and a gross annualized Sharpe ratio of 0.66.
- The real GDP growth portfolio, long (short) the fourth of currencies with the lowest (highest) lagged GDP growth, generates a gross annualized average excess return of about 3%. The real money growth portfolio, long (short) the fourth of currencies with the lowest (highest) lagged real money growth, generates a gross annualized average excess return of about 6%. Combining real GDP growth and real money growth generates a gross annualized average excess return higher than that of the carry trade and a gross annualized Sharpe ratio of 0.65.
- The real exchange rate portfolio, long (short) the fourth of currencies with the highest (lowest) real exchange rates, generates a gross annualized average excess return of about 4.5% and a gross annualized Sharpe ratio of 0.51.
- The real GDP growth and real money growth strategies are largely unrelated to the carry trade strategy (return correlation 0.18). There is a substantial relationship between the real exchange rate strategy and the carry trade strategy (return correlation 0.55). An equally weighted combination of carry trade, real GDP/money growth and real exchange rate strategies generates a gross annualized Sharpe ratio of 1.08.
- Predictability derives mostly from variation in economic fundamentals across countries (varying business cycle risks) and not from variation of fundamentals over time for any given country.
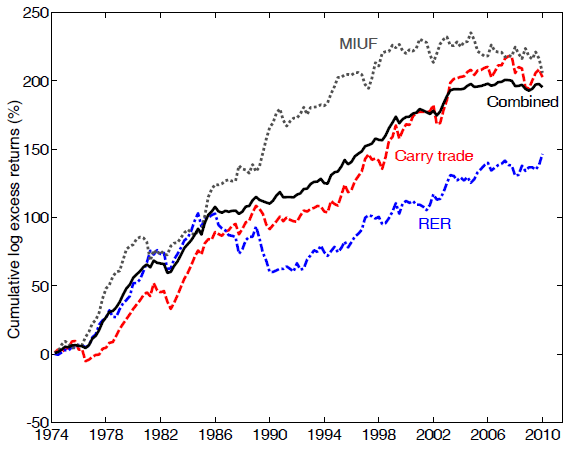
The following chart, taken from the paper, shows cumulative gross long excess returns for four currency hedge strategies:
- Carry trade: long (short) currencies with the highest (lowest) interest rates.
- Real GDP growth combined with real money growth (MIUF): long (short) currencies with the lowest (highest) growth.
- Real exchange rate (RER): long (short) currencies with the highest (lowest) real exchange rates.
- An equally weighted combination of the three strategies, rebalanced annually at year-end.
Strategies 1, 2 and 3 generate gross annualized Sharpe ratios in the range 0.51 to 0.66. Because the strategies are substantially uncorrelated, the equally weighted combination generates a gross annualized Sharpe ratio of 1.08, largely due to suppression of volatility.
Note the relatively weak performance of these strategies in recent years.
In summary, evidence indicates that currency traders can earn gross excess returns by choosing long and short positions according to lagged economic fundamentals (interest rate, real GDP growth, real money growth and real exchange rate) across countries.
Cautions regarding findings include:
- Returns in the paper are gross, not net, mitigated by infrequent (annual) portfolio reformation. Accounting for trading frictions would reduce reported returns.
- The strategy combining the portfolios for all economic variables would bear higher trading frictions due to a higher number of positions.
Frequently Asked Questions
What is a currency carry trade and how does it differ from other currency strategies based on economic fundamentals?
A currency carry trade is a multi-currency hedge strategy that goes long the quarter of currencies with the highest interest rates and short the quarter with the lowest interest rates. In the study of 35 currencies versus the U.S. dollar (Q1 1974–Q3 2010), it generated a gross annualized excess return of about 6% and a Sharpe ratio of 0.66. Other fundamentals-based strategies instead sort currencies on real GDP growth, real money growth, or real exchange rates.
Do economic fundamentals predict currency exchange rate returns?
Economic fundamentals do predict currency returns, with unlevered hedge portfolios earning gross average annualized excess returns over short-term interest rates of up to 6% in out-of-sample tests from Q1 1974 through Q3 2010. Carry trade and real money growth portfolios each earned about 6%, the real exchange rate portfolio about 4.5%, and the real GDP growth portfolio about 3%. These returns are gross, not net of trading costs.
How are currency hedge portfolios built from economic fundamentals like GDP growth and money growth?
Currency hedge portfolios are built by ranking 35 currencies against the U.S. dollar on a lagged economic variable (interest rate, real GDP growth, real money growth, or real exchange rate) and going long and short the extreme quartiles. Growth rates use 20-quarter rolling averages, portfolios are rebalanced annually at year end, and returns are measured in excess of short-term interest rates. For GDP and money growth, the portfolio is long the lowest-growth quartile and short the highest-growth quartile.
How do GDP growth and real exchange rate currency strategies compare with the carry trade, and does combining them help?
The real GDP growth and real money growth strategies are largely unrelated to the carry trade (return correlation 0.18), while the real exchange rate strategy is substantially related to it (correlation 0.55). Combining real GDP and money growth earned a gross return higher than the carry trade with a Sharpe ratio of 0.65. An equally weighted combination of carry trade, growth, and real exchange rate strategies reached a gross annualized Sharpe ratio of 1.08, largely from reduced volatility.
What are the limitations of trading currencies based on economic fundamentals?
The reported returns from fundamentals-based currency trading are gross rather than net, so accounting for trading frictions would reduce them, though annual rebalancing mitigates this. The combined strategy using all fundamentals holds more positions and would bear higher trading costs. The strategies also performed relatively weakly in recent years of the sample.