
Should long-term investors focus on terminal wealth and ignore interim volatility? In his August 2013 paper entitled “Rethinking Risk”, Javier Estrada compares distributions of terminal wealths for $100 initial investments in stocks or bonds over investment horizons of 10, 20 or 30 years. He utilizes mean, median, tail (extreme 1%, 5% and 10%) and risk-adjusted performance metrics. He employs real returns for 19 country markets adjusted by local inflation and in local currency for individual country markets, and adjusted by U.S. inflation and in dollars for the (capitalization-weighted) World market. Using real annual total returns for indexes of stocks and government bonds in each country during 1900 through 2009 (101, 91, and 81 overlapping intervals of 10, 20, and 30 years), he finds that:
- The mean, median, upper tail and lower tail (whether for 1%, 5% or 10% tails) terminal wealths are higher for stocks than government bonds in the World market and in every country for holding intervals of 10, 20 or 30 years.
- However, stocks are riskier than bonds based on standard deviation of either terminal wealths across all holding intervals of 10, 20 or 30 years or annual returns (one-year holding interval) in the World market and in every country.
- On a risk-adjusted basis:
- The ratio of mean terminal wealth to standard deviation of annual returns is lower for stocks than government bonds in the U.S., the World market and nearly all of the other countries for all three holding intervals.
- The ratio of mean terminal wealth to standard deviation of terminal wealths for a specified holding interval is higher for stocks than government bonds in the U.S., the World market and many other countries for 20‐year and 30‐year holding intervals, but the opposite is true for a 10‐year holding interval.
- A focus on terminal wealth suggests that the higher return volatility of stocks versus bonds is about upside, not downside, uncertainty (see the chart below).
The following chart, constructed from data in the paper, summarizes mean (average) and standard deviations of the terminal wealths from $100 initial investment in U.S. stocks or U.S. government bonds over all 10‐year, 20‐year and 30‐year (overlapping) holding intervals during 1900 through 2009. Results suggest that the higher volatilities in terminal wealth for stocks are upside uncertainties, and that upside uncertainty increases with investment horizon.
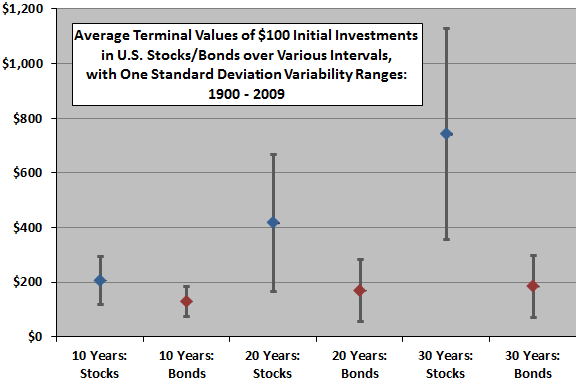
In summary, evidence suggests that disciplined long-term investors should focus on estimated terminal wealth (and distributions of long-term terminal wealths), not short-term volatilities, in selecting assets.
Cautions regarding findings include:
- Even a 110-year sample has only about 3.7 independent 30-year investment intervals.
- The study uses indexes, not accounting for the costs of creating and maintaining tradable assets. Incorporating these costs would lower reported terminal wealths. The study also does not address costs/feasibility of reinvesting dividends/coupons.
- The study does not address potential enhancement of terminal values via long-term diversification across asset classes with systematic rebalancing.
- Those nearing the end of their initially long-term horizons become short-term investors.
Frequently Asked Questions
What is terminal wealth and why do long-term investors focus on it?
Terminal wealth is the final value of an investment at the end of a chosen holding period, such as the end value of a $100 initial investment after 10, 20 or 30 years. Focusing on terminal wealth means evaluating assets by the distribution of their end-of-horizon outcomes rather than by interim (e.g., annual) volatility. Javier Estrada's 2013 paper argues disciplined long-term investors should select assets this way.
Do stocks outperform bonds over long investment horizons?
Stocks outperformed government bonds on mean, median, upper-tail and lower-tail (1%, 5% and 10%) terminal wealth in the World market and in all 19 countries studied, for 10-, 20- and 30-year holding intervals during 1900-2009. These results use real annual total returns. The finding is historical and based on indexes, so it does not guarantee future outperformance.
How is terminal wealth compared between stocks and bonds across different holding periods?
Terminal wealth is compared by calculating the end value of a $100 initial investment in stock or government bond indexes over all overlapping 10-, 20- and 30-year intervals during 1900-2009 (101, 91 and 81 intervals respectively). Distributions are evaluated using mean, median, extreme-tail (1%, 5%, 10%) and risk-adjusted metrics. Returns are real, adjusted by local inflation in local currency for 19 countries, and by U.S. inflation in dollars for the capitalization-weighted World market.
Is stock volatility the same as downside risk when investing for the long term?
No. In Estrada's analysis, stocks have higher standard deviation than bonds in both annual returns and terminal wealths, but the higher terminal-wealth volatility of stocks reflects mainly upside uncertainty, which increases with investment horizon. On risk-adjusted measures, mean terminal wealth to standard deviation of annual returns is lower for stocks than bonds in the U.S., the World market and nearly all other countries. The ratio using standard deviation of terminal wealths is higher for stocks at 20- and 30-year horizons in the U.S., the World and many countries, but not at 10 years.
What are the limitations of using terminal wealth to choose between stocks and bonds?
The 110-year sample contains only about 3.7 independent 30-year intervals, limiting statistical power. The study uses indexes, ignoring the costs of creating and maintaining tradable assets (which would lower terminal wealths) and the costs and feasibility of reinvesting dividends and coupons. It also does not examine long-term diversification across asset classes with systematic rebalancing, and investors nearing the end of a long horizon effectively become short-term investors.