
Who are the givers and who are the takers among mutual funds and hedge funds? In their January 2016 paper entitled “Style and Skill: Hedge Funds, Mutual Funds, and Momentum”, Mark Grinblatt, Gergana Jostova, Lubomir Petrasek and Alexander Philipov analyze quarter-to-quarter changes in Form 13F stock holdings to assess investment styles and sources of performance for hedge funds and mutual funds. They focus on the interaction between portfolio weight changes and future stock returns to measure investing skill. They calculate fund alpha via adjustments for stock size, book-to-market ratio and (when appropriate) momentum. Using quarterly 13F filings of 589 mutual funds and 1,342 hedge funds during 1998 to 2012, they find that:
- Most hedge funds (about two thirds) are contrarian, buying stocks with low past returns. 80% of hedge funds that are contrarian during the first half of the sample period remain contrarian during the second half.
- Contrarian hedge funds generate 2.4% average gross annual alpha, outperforming contrarian mutual funds, momentum mutual funds and momentum hedge funds (see the charts below).
- Outperformance of contrarian hedge funds derives mostly from stock picking (selecting the right losers). The net purchases of these funds generate 2.2% average gross annual alpha, outperforming net sales (excluding short sales) by 3.2% average gross annual alpha.
- Performance persistence exists among contrarian hedge funds, but not among any other group of funds/institutional investors.
- Most mutual funds (about two thirds) follow momentum both for purchases and sales. 76% of mutual funds that follow momentum during the first half of the sample period continue to follow momentum during the second half.
- Momentum mutual funds outperform contrarian mutual funds.
- After controlling for momentum, mutual funds exhibit no stock picking skill.
- The most profitable trades of contrarian hedge funds are purchases of stocks sold by momentum mutual funds, which are perhaps forced sales to maintain investor liquidity.
The following charts, taken from the paper, track 36-month moving averages of monthly alphas of portfolio changes (equally weighted buys minus sells) for contrarian hedge funds and mutual funds (upper chart) and momentum hedge funds and mutual funds (lower chart). Results indicate that only the trades of contrarian hedge fund advisors consistently produce a positive alpha over the sample period. Trades of momentum hedge funds are roughly neutral. Trades of mutual funds mostly generate negative alpha.
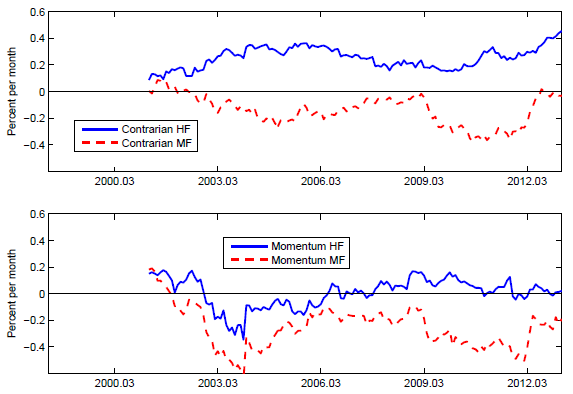
In summary, evidence indicates that contrarian hedge funds outperform momentum hedge funds and both contrarian and momentum mutual funds, mostly due to superior stock picking.
Cautions regarding findings include:
- Results are gross and idealized (equally weighted), not net. In other words, results may not match the experiences of fund investors due to impacts of trading frictions, fixed fees, incentive fees, high-water marks and actual portfolio weights.
- Many investors do not have access to hedge funds.
- Mutual funds generally offer investors greater liquidity than hedge funds, and that liquidity involves a cost.
- Following the trades of contrarian hedge funds via 13F filings would involve a lag that may work against exploitation.
Frequently Asked Questions
What is a contrarian investing style, and how does it differ from momentum investing?
A contrarian investing style means buying stocks with low past returns (recent losers), while momentum investing means buying stocks with high past returns and selling those with low past returns. In a study of 13F holdings from 1998 to 2012, about two thirds of hedge funds were contrarian and about two thirds of mutual funds followed momentum for both purchases and sales.
Do contrarian hedge funds outperform mutual funds and momentum hedge funds?
Contrarian hedge funds outperformed contrarian mutual funds, momentum mutual funds and momentum hedge funds, generating 2.4% average gross annual alpha during 1998 to 2012. The outperformance derived mostly from stock picking, and contrarian hedge funds were the only group showing performance persistence. After controlling for momentum, mutual funds showed no stock picking skill.
How can you measure fund manager skill and alpha using quarterly 13F stock holdings?
Researchers measure skill by analyzing quarter-to-quarter changes in 13F stock holdings and relating portfolio weight changes to future stock returns. Fund alpha is calculated with adjustments for stock size, book-to-market ratio and, when appropriate, momentum. The study applied this approach to quarterly filings of 589 mutual funds and 1,342 hedge funds from 1998 to 2012, using equally weighted buys minus sells.
Why do contrarian hedge funds profit from trades that momentum mutual funds make?
The most profitable trades of contrarian hedge funds were purchases of stocks sold by momentum mutual funds, which are perhaps forced sales to maintain investor liquidity. Contrarian hedge fund net purchases generated 2.2% average gross annual alpha and outperformed net sales (excluding short sales) by 3.2%. By contrast, momentum mutual funds outperformed contrarian mutual funds, but trades of mutual funds mostly generated negative alpha.
What are the limitations of copying hedge fund trades from 13F filings?
The reported contrarian hedge fund alpha is gross and idealized (equally weighted), so it may not match investor experience after trading frictions, fixed fees, incentive fees, high-water marks and actual portfolio weights. Following 13F filings involves a reporting lag that may work against exploitation, and many investors lack access to hedge funds. Mutual funds also generally offer greater liquidity than hedge funds, and that liquidity involves a cost.