
Does cyclic information flow from the Federal Open Market Committee (FOMC) drive equity market returns? In the June 2016 update of their paper entitled “Stock Returns Over the FOMC Cycle”, flagged by a subscriber, Anna Cieslak, Adair Morse and Annette Vissing-Jorgensen investigate interaction of the FOMC six-week meeting cycle with excess U.S. and worldwide stock market (relative to the U.S. Treasury bill). Within the FOMC meeting cycle, they look at:
- Meetings of the Federal Reserve Board of Governors and public releases of Federal Reserve book updates, statements and meeting minutes.
- Other potentially influential economic news cycles, including reserve maintenance period, macroeconomic news releases and corporate earnings announcements.
- Evidence on leaks from the Federal Reserve via media and private newsletters (with focus on Wall Street Journal articles on monetary policy).
- Public statements of Federal Reserve officials and conversations with current and former officials.
Using these data, FOMC meeting dates and daily U.S. and global (overall, developed and emerging) stock market returns, returns for individual U.S. stocks, U.S. Treasury bill (T-bill) yield and 10-year U.S. Treasury note yield during 1994 through 2015, they find that:
- Over the sample period, the U.S. equity risk premium (stock market return minus T-bill yield) accrues entirely during weeks 0, 2, 4 and 6 of the FOMC meeting cycle (see the chart below).
- This biweekly pattern is robust for 1994-2006 and 2007-2015 subperiods.
- The pattern is amplified for high-beta stocks.
- A strategy that holds the U.S. stock market only during FOMC meeting cycle even weeks generates an average gross annual excess return of 11.8% with standard deviation 13.3%, translating to gross annual Sharpe ratio 0.88. Respective statistics for buying and holding the market are 8.3%, 19.1% and 0.43.
- Additionally shorting the U.S. stock market during FOMC meeting cycle odd weeks boosts average gross annual excess return to 14.8% but also increases annual volatility to 21.1%, thereby reducing Sharpe ratio to 0.70.
- The pattern also holds for the MSCI World equity market index and separately for MSCI developed and emerging market indexes.
- The pattern does not hold for 10-year U.S. Treasury note returns.
- Federal Reserve reaction to poor stock market returns (a surprising intent to ease monetary conditions) is the principal driver of the pattern, most likely communicated informally by Federal Reserve officials to the media and to individuals in the financial industry.
The following chart, taken from the paper, tracks average U.S. stock market excess return over the next five days in percent by weekday (omitting weekends and setting holiday returns to zero) across the FOMC meeting cycle during the sample period (176 meetings). Day 0 is the meeting day, and 10 days corresponds to two calendar weeks. Results indicate a pronounced biweekly cycle in next-week excess return. Results are similar for global equity markets.
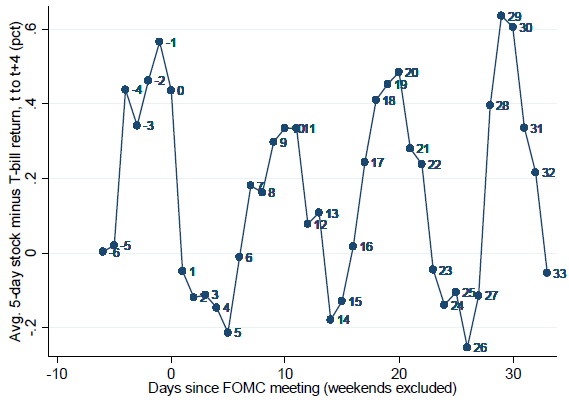
In summary, evidence indicates that there is a biweekly cycle in stock market returns driven by Federal Reserve reaction to poor lagged returns and communicated informally to the media and financial industry insiders.
Cautions regarding findings include:
- Return calculations are gross, not net. Accounting for FOMC meeting cycle even-week entries and odd-week exits from stocks (26 round trips per year) would reduce these returns. Shorting costs would debit profitability of shorting during odd weeks.
- The argument posits that surprising Federal Reserve intent to ease monetary conditions in response to recent stock market weakness stems from the October 1987 crash experience. Federal Reserve behavior could change.
- Public discussion of the findings of this paper may inhibit the informal communication from Federal Reserve officials to the media and financial industry insiders, thereby disrupting the pattern.
See also “FOMC Drives Global Equity Markets?”.
Frequently Asked Questions
What is the FOMC meeting cycle and what are even weeks?
The FOMC meeting cycle is the roughly six-week period between Federal Open Market Committee meetings, with week 0 being the meeting week. Even weeks are weeks 0, 2, 4 and 6 of that cycle, and odd weeks are the weeks in between. Researchers study this cycle because information flow from the Federal Reserve appears to follow it, affecting stock returns.
Does holding stocks only during FOMC even weeks beat buy-and-hold?
Holding the U.S. stock market only during FOMC cycle even weeks outperformed buy-and-hold over 1994-2015 on a gross basis. It produced an average annual excess return of 11.8% with 13.3% standard deviation and a Sharpe ratio of 0.88, versus 8.3%, 19.1% and 0.43 for buy-and-hold. The U.S. equity risk premium accrued entirely during weeks 0, 2, 4 and 6, and the pattern held in 1994-2006 and 2007-2015 subperiods.
How was the FOMC cycle effect on stock returns tested?
The FOMC cycle effect was tested using FOMC meeting dates (176 meetings) and daily U.S. and global stock market returns, individual U.S. stock returns, T-bill yields and 10-year Treasury note yields from 1994 through 2015. The researchers measured average stock market excess return (relative to the T-bill yield) by weekday across the cycle, and compared a strategy holding stocks only in even weeks against buy-and-hold. They also examined other news cycles, such as reserve maintenance periods, macroeconomic releases and earnings announcements, plus evidence of Fed leaks via media.
Does the FOMC even-week pattern also appear in global stocks and Treasury notes?
The FOMC even-week pattern also holds for the MSCI World equity index and separately for MSCI developed and emerging market indexes. It does not hold for 10-year U.S. Treasury note returns. The pattern is also amplified for high-beta stocks.
What are the limitations of trading stocks based on the FOMC even-week cycle?
The reported FOMC even-week returns are gross, not net, so the 26 round trips per year of entering in even weeks and exiting in odd weeks would reduce them. Shorting costs would also reduce the profitability of shorting during odd weeks, which lifted gross excess return to 14.8% but cut the Sharpe ratio to 0.70. The pattern relies on informal Fed communication tied to the Fed's reaction to weak stocks since the October 1987 crash, so changed Fed behavior or public discussion of the findings could disrupt it.