
Should investors trust academic equity factor research? In their February 2019 paper entitled “A Census of the Factor Zoo”, Campbell Harvey and Yan Liu announce a comprehensive database of hundreds of equity factors from top academic journals and working papers through January 2019, including a link to citation and download information. They distinguish among six types of common factors and five types of firm characteristic-based factors. They also explore incentives for factor discovery and reasons why many factors are lucky findings that exaggerate expectations and disappoint in live trading. Finally, they announce a project that allows researchers to add published and working papers to the database. Based on their census of published factors and analysis of implications, they conclude that:
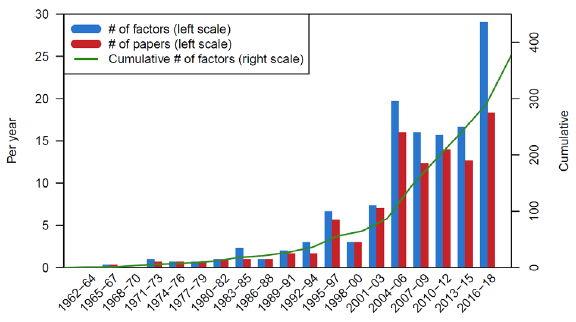
- Through 2018, top academic journal articles identify 382 factors (see the chart below), materially reusing the same source data.
- Moreover, there are likely many (“file drawer”) factor studies discarded because of negative findings unlikely to be accepted for publication.
- Such multiple testing (data snooping) degrades statistical significance through discovery of factors that are simply lucky in the available sample. For example, one of 20 insignificant factors tested on the same data is likely to achieve conventional (5% level) statistical significance by luck.
- There are several ways to correct for multiple testing that increase the statistical significance threshold with the number of tests. However, it is arguable that thresholds for factors derived from careful theory should be lenient compared to those discovered by brute force experimentation.
- Finally, academic factor studies routinely ignore trading frictions, such that their findings are for “gross” factors, not “net” (practically exploitable) factors. Accounting for reasonable trading frictions has an effect similar to that of raising the statistical significance threshold, with disparate impact on factors with different turnovers and dependencies on the contribution of small stocks.
The following chart, taken from the paper, summarizes the rate of publishing of new equity factors in top academic journals and cumulative number published through 2018. Through 2018, the number is approaching 400 factors, with the preponderance discovered after the early 2000s. This count does not include those factors appearing only in working papers or those discarded as uninteresting during the search process. All discoveries/discards contribute to data snooping bias.
In summary, equity factor research in aggregate overstates investment return expectations. Stock and equity style pickers should be skeptical of academic underpinnings of their beliefs.
Cautions regarding conclusions include:
- As noted in the paper, the number of equity factors identified in published research understates data snooping, arguably by a lot.
- The paper focuses on U.S. equity factors because most relevant research does also. Snooping of factors for other asset classes may be less severe, but the case for skepticism is similar.
See also “Inflated Expectations of Factor Investing” and the results of this search.
Frequently Asked Questions
What is the factor zoo in equity investing?
The factor zoo is the large and growing collection of equity factors, meaning stock characteristics or common return drivers, proposed in academic research to explain or predict returns. Harvey and Liu's census counted 382 factors published in top academic journals through 2018, grouped into six types of common factors and five types of firm characteristic-based factors.
Can investors trust academic equity factor research to predict future returns?
Academic equity factor research in aggregate overstates investment return expectations, according to Harvey and Liu's 2019 census. Multiple testing (data snooping) produces lucky findings, and published studies typically ignore trading frictions. Investors and stock pickers should therefore be skeptical of the academic basis for their beliefs about factors.
How do researchers correct for data snooping when testing many stock market factors?
Researchers correct for multiple testing by raising the statistical significance threshold as the number of tests increases. This matters because, for example, one in 20 insignificant factors tested on the same data is likely to look significant at the 5% level by luck. Harvey and Liu note it is arguable that factors derived from careful theory deserve more lenient thresholds than those found by brute-force experimentation.
What is the difference between gross and net equity factor returns?
Gross factor returns, which academic studies routinely report, ignore trading frictions, while net factor returns reflect what is practically exploitable after those costs. Accounting for reasonable trading frictions has an effect similar to raising the statistical significance threshold. The impact differs across factors depending on their turnover and their reliance on small stocks.
What are the limitations of counting published equity factors to measure data snooping?
The count of 382 published factors likely understates data snooping, arguably by a lot, because it excludes factors found only in working papers and "file drawer" studies discarded after negative results. The census also focuses on U.S. equity factors because most relevant research does. Snooping in other asset classes may be less severe, but the case for skepticism is similar.