
A reader wondered about the value of combining momentum and simple moving average signals for asset class allocation, as follows:
- Each month calculate the average momentum of each asset class over the prior 3, 6 and 12 months
- Hold the top positions as long as they are also trading above their 10-month SMA (otherwise go to cash)
We test these rules using exchange-traded funds (ETF) as easily tradable asset class proxies. However, many ETFs have very short histories, greatly restricting any such test. We use S&P Depository Receipts (SPY), iShares Barclays 20+ Year Treasury Bond (TLT) and iShares Russell 2000 Index (IWM) as available asset classes, with historical data limited to July 2002 (by TLT). We use the 13-week Treasury bill (T-bill) yield as a proxy for the return on cash. Each month, we allocate funds to the one asset class with the highest average momentum over the prior 3, 6 and 12 months, unless the momentum leader is below its lagged 10-month SMA, in which case we put all funds into T-bills. Using monthly values for SPY, TLT, IWM and the T-bill yield over the period July 2002 through April 2009 (82 months), we find that:
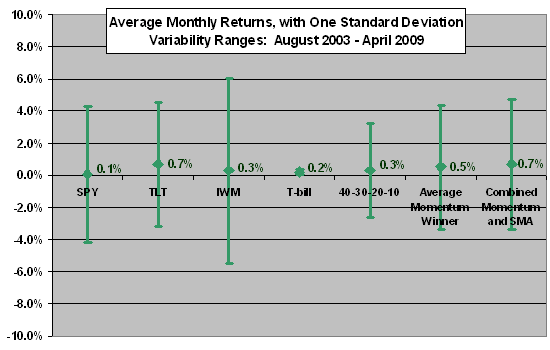
The following chart summarizes average monthly returns and variabilities for seven cases over the period August 2003 through April 2009, as follows:
- Buy and hold SPY.
- Buy and hold TLT.
- Buy and hold IWM.
- Hold T-bills continuously.
- Allocate 40%-30%-20%-10% to SPY-TLT-IWM-Cash, rebalancing monthly at the close (40-30-20-10).
- Allocate all funds monthly at the close to SPY, TLT or IWM based on the highest lagged average momentum (Average Momentum Winner).
- Allocate all funds monthly at the close to SPY, TLT or IWM based on the highest lagged average momentum, unless the momentum winner is below its 10-month SMA, in which case all funds go to T-bills (Combined Momentum and SMA).
The start date of August 2003 is based on calculation of 12-month lagged momentum starting in July 2002.
The winners based on average monthly return are buy-and-hold TLT and Combined Momentum and SMA. Their standard deviations of monthly returns are close, but that of Combined Momentum and SMA is slightly higher (and also slightly higher than that for Average Momentum Winner). The Combined Momentum and SMA approach substitutes T-bills for the momentum winner in only three of 69 months.
The fixed 40-30-20-10 asset allocation approach offers the lowest portfolio variability.
This sample period is very short for evaluating asset class allocation strategies. Testing across multiple business (interest rate) cycles is desirable.
Including more asset classes may well improve the performance of all three of the above asset allocation approaches. Holding multiple asset class momentum winners (rather than just one winner) from a larger selection may hurt or help average returns, depending on how often momentum winners are below their 10-month SMAs and therefore default to cash.
Other combinations of rules are possible. Testing different cases across the same data introduces some data snooping bias in results.
In summary, a very limited test suggests that adding simple moving average signals to asset class momentum investing may enhance returns.
Frequently Asked Questions
What is a combined momentum and simple moving average strategy for asset allocation?
A combined momentum and simple moving average (SMA) strategy ranks asset classes by their average return over the prior 3, 6 and 12 months and holds the leader only if it trades above its 10-month SMA. If the leader is below its 10-month SMA, the strategy moves all funds to cash (T-bills). It is typically implemented monthly using ETFs as asset class proxies.
Does adding a moving average filter improve asset class momentum returns?
Adding a 10-month moving average filter to asset class momentum may enhance returns, but the evidence is very limited. Over August 2003 through April 2009, the Combined Momentum and SMA strategy matched buy-and-hold TLT for the highest average monthly return, with slightly higher volatility than TLT and plain momentum. The filter moved the portfolio to T-bills in only 3 of 69 months.
How do you test a momentum and 10-month moving average strategy using ETFs?
Each month, the strategy allocates all funds to the one ETF among SPY, TLT and IWM with the highest average momentum over the prior 3, 6 and 12 months, unless that ETF is below its lagged 10-month SMA, in which case funds go to 13-week T-bills. The test used monthly data from July 2002 through April 2009, with returns measured from August 2003 (69 months) because 12-month momentum needs a year of history. Results were compared with buy-and-hold SPY, TLT, IWM, T-bills, a fixed 40-30-20-10 SPY-TLT-IWM-cash allocation, and plain momentum.
How does a combined momentum and SMA strategy compare with a fixed asset allocation or buy-and-hold?
The combined momentum and SMA strategy and buy-and-hold TLT produced the highest average monthly returns in the August 2003–April 2009 test, with similar standard deviations (the combined strategy's slightly higher). The fixed 40-30-20-10 SPY-TLT-IWM-cash allocation, rebalanced monthly, had the lowest portfolio variability. The combined strategy was also slightly more volatile than the plain average-momentum winner strategy.
What are the limitations of testing a momentum and moving average asset allocation strategy?
The test covers a very short sample (69 months) and only three asset classes (SPY, TLT, IWM), and it does not span multiple business or interest rate cycles. Testing different rule cases on the same data also introduces some data snooping bias. Results could change with more asset classes, holding multiple momentum winners, or other rule combinations, so the finding is only suggestive.