The Halloween effect (higher winter than summer returns) appears marketwide and distinct from the January effect, with statistically significant winter premiums in most portfolios (Fama-French U.S. equal- and value-weighted portfolios; 1926–2004; descriptive).
In their August 2005 draft paper entitled “Seasonal, Size and Value Anomalies”, Ben Jacobsen, Abdullah Mamun and Nuttawat Visaltanachoti examine the Halloween (or sell-in-May) effect (significantly higher returns during winter months than during summer months) and its relationship to the January effect and other anomalies for both equal-weighted and value-weighted U.S. market portfolios. Other anomalies they consider include those based on on firm capitalization, dividend yield, book-to-market ratio, earnings-to-price ratio and cash flow-to-price ratio. Using the Fama-French data library for 1926-2004, they find that:
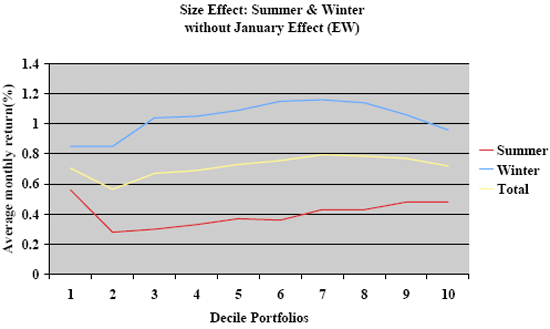
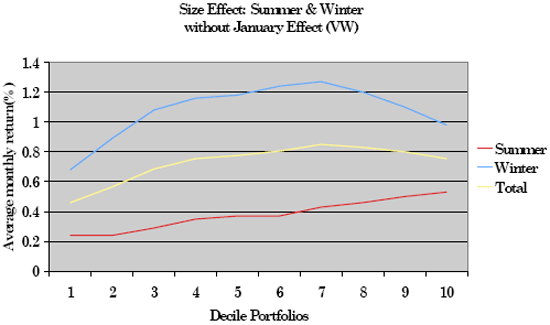
Unlike the January effect, the Halloween effect seems to be a marketwide phenomenon. The two effects are distinct. (See charts below.)
The Halloween effect is likewise generally independent of the other anomalies considered. Most portfolios show statistically and economically significant higher average winter returns than summer returns.
In contrast, the January effect intertwines with the small-firm and the book-to-market ratio anomalies. Controlling for the January effect and using value-weighted portfolios halves the earnings-to-price, cash flow-to-price and dividend yield anomalies.
The following two charts, extracted from the paper, illustrate the independence of the Halloween effect from the January effect across all firm capitalization deciles for both equal-weighted (EW) and value-weighted (VW) U.S. equity portfolios.
In summary, the average investor in the U.S. equities will have difficulty avoiding relatively poor returns during the summer. They should focus on the winter months.
Asset Class ETF Seasonalities? PremiumAverage monthly returns for nine asset class ETFs (SPY, IWM, EFA, EEM, TLT, LQD, VNQ, GLD, DBC) are mostly positive in April, July, November…
Style Performance by Calendar Month PremiumStyle ETFs show modest monthly return differences versus SPY, with value outperforming growth in Mar/Apr/Dec and growth leading in Oct/Nov (Aug 2001–Oct 2021; 20-year…
Sector Performance by Calendar Month PremiumAverage returns and return dispersion across nine Select Sector SPDR ETFs (XLB, XLE, XLF, XLI, XLK, XLP, XLU, XLV, XLY) differ somewhat by calendar…
“Sell in May” Over the Long Run Premium"Sell in May" stocks underperformed November-April stocks (CAGR not specified vs buy-and-hold benchmark; Apr 1871–Apr 2021; seasonal timing with 1% trading costs; S&P Composite…
Stock Market Continuation and Reversal Months? PremiumCalendar-month correlations between S&P 500 and Russell 2000 monthly returns and prior 3-, 6- and 12-month returns show unstable continuation/reversal patterns across subperiods and…