Can traders exploit a tendency of some investors to over-anticipate good or bad news just before firm earnings announcements? In their 2016 paper entitled “Fear and Greed: a Returns-Based Trading Strategy around Earnings Announcements”, flagged by a subscriber, Ivo Jansen and Andrei Nikiforov investigate post-release reversal of extreme abnormal returns during the week before an earnings announcement. Specifically, they test a trading strategy that on earnings announcement day through the next day takes a long (short) position in stocks with extreme negative (positive) abnormal returns during the prior week. They define abnormal returns as the difference between a target stock’s return and the average return of the ranked tenth (decile) of stocks sorted on size (market capitalization) to which the stock belongs. To define extreme returns during the pre-announcement week, they consider returns outside thresholds of -5%/+5%, -10%/+10% and -15%/+15%. Using quarterly firm size, earnings announcement dates and associated daily stock prices for a broad sample of U.S. stocks priced at least $2 per share from the second half of 1971 through 2012, they find that:
- For the -10%/+10% thresholds:
- 3.9% (5.8%) of stock-quarter observations in the sample exhibit abnormal returns below -10% (above +10%) during the week before earnings announcements.
- During earnings announcement day through the next day, long (short) positions earn average gross abnormal return 1.49% (1.20%). These return reversals are about 60% larger than those observed after extreme returns before non-earnings announcement days.
- Trades in small stocks generate the highest average gross return, but those for medium and big stocks are also statistically and economically significant.
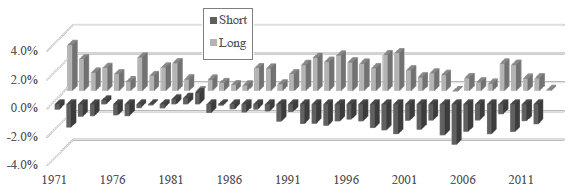
- The strategy is profitable in 40 of 42 years in the sample, with overall average gross trade return of 1.3%, performing similarly during bull and bear markets (see the chart below).
- Since 2000, assuming round trip trading frictions of 0.70%, the average net abnormal return per trade is 0.76%.
- Gross profitability increases with the thresholds used to define extreme abnormal returns during the pre-announcement week.
- For the -5%/+5% thresholds, average gross abnormal return for the long (short) positions is 0.80% (0.68%).
- For the -15%/+15% thresholds, average gross abnormal return for the long (short) positions is 2.26% (1.74%).
- Results are qualitatively similar when defining abnormal returns using only the market return or the Fama-French three-factor (market, size, book-to-market) model.
The following chart, taken from the paper, summarizes average gross returns for the stocks in the short and long sides of the trading strategy with -10%/+10% thresholds by year over the 42-year sample period. The long and short sides are are separately profitable on a gross basis in 40 and 38, respectively. Combining the two sides, the strategy is profitable in 40 years.

In summary, evidence indicates that extreme stock price movements just prior to earnings announcements represent over-anticipation reliably subject to post-announcement reversals.
Cautions regarding findings include:
- The assumed level of trading frictions is low for the first half of the sample period (see “Trading Frictions Over the Long Run”). Also:
- During times of high idiosyncratic stock volatility, such as that during signal development and reversal in this strategy, bid-ask spread and price impact of trading may be elevated, such that trading frictions are abnormally high.
- Shorting costs would reduce reported performance. Shorting may not be feasible for some stocks identified for shorting due to lack of shares available for borrowing.
- The annualized average performances per trade reported in the paper (ranging from a net 95% to a gross 160%) are specious. Average trade performance is not sufficient to determine portfolio-level return. Other considerations are (see “Chapter 6: Modeling at the Portfolio Level”):
- Volatility of returns.
- Percentage of time when there are no trade signals.
- Broker-required cash margin set aside, and sometimes idle, to exploit trades as signaled.