Market capitalization is the most frequently used metric for weighting the individual stock components of market indexes. Other approaches range from equal weighting to weighting on firm fundamentals to weighting generated by return-risk optimization. How do such alternative metrics work empirically? In the October 2010 draft of their paper entitled “A Survey of Alternative Equity Index Strategies”, Tzee-man Chow, Jason Hsu, Vitali Kalesnik and Bryce Little examine several popular passive index weighting alternatives to market capitalization. They impose common assumptions to backtest these alternatives on U.S. and global equity data over long periods with either annual or quarterly rebalancing. They also apply the Fama-French three-factor model to investigate sources of outperformance relative to capitalization-weighted benchmarks. Using stock/firm data for the 1,000 largest global firms spanning 1987-2009 and for the largest 1,000 U.S. firms spanning 1964-2009, they find that:
The authors consider the following alternative weighting strategies/variations, referring to the first five as heuristic strategies and the last four as optimization strategies:
- Weight each stock equally (Equal).
- Weight equally clusters of capitalization-weighted country-sector groupings associated by risk with high ranking granularity (k/2 EW Risk Clusters).
- Weight equally clusters of capitalization-weighted country-sector groupings associated by risk with low ranking granularity (k/2 EW Risk Clusters).
- Blend capitalization weighting with equal weighting by shifting capitalization weights somewhat toward equal weights somewhat (p=0.76 Diversity).
- Blend capitalization weighting with equal weighting by shifting capitalization weights more strongly toward equal weights (p=0.5 Diversity).
- Weight by averaging four sub-weights calculated from five years of historical total sales, cash flow and dividends paid and the most recent year’s book value (Fundamentals).
- Weight to minimize portfolio variance based on historical returns (Minimum Variance).
- Weight to maximize Sharpe ratio based on historical returns and an assumed linear relationship between expected return minus risk-free rate and return volatility for each stock (Maximum Diversification).
- Weight to maximize Sharpe ratio based on historical returns and an assumed linear relationship between expected return and downside semi-volatility for each stock, with either narrow or wide limits on portfolio weights (Risk Efficient-Narrow and Risk Efficient-Wide).
Backtesting of these alternatives over global and U.S. samples indicates that:
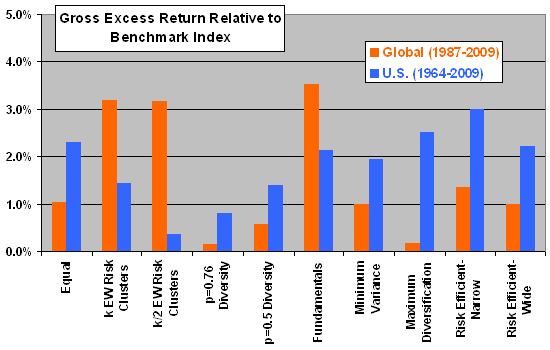
- All alternative weighting strategies outperform capitalization‐weighted benchmark indexes (see the first chart below).
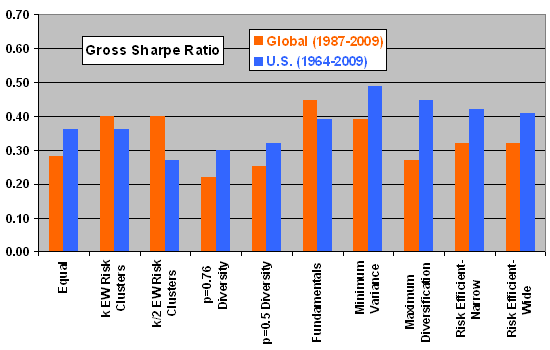
- The interplay of strategy return and strategy volatility, as represented by the Sharpe ratio, tends to level the playing field across strategies (see the second chart below).
- Fama-French three-factor decompositions indicate that outperformance of all alternative weighting strategies relative to capitalization weighting derives largely from exposure to the value premium and size effect.
- Quarterly versus annual rebalancing has little effect on alternative weighting strategy gross returns but roughly doubles portfolio turnovers.
- Reducing the universe from the 1,000 largest stocks to the 500 largest stocks depresses Sharpe ratios for all alternative strategies.
- Iterative relaxation of limits on concentrations for individual stocks within alternative weighting strategies generally shifts strategy performance toward that of equal weighting.
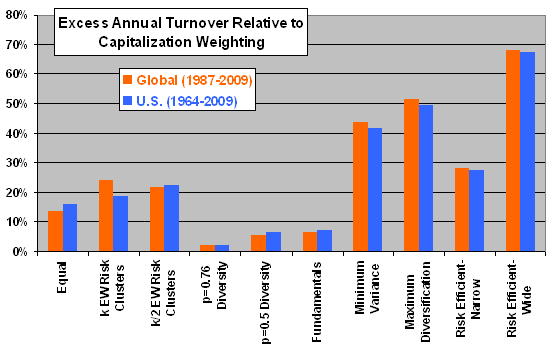
- The optimization strategies have high portfolio turnovers, such that net outcomes may be more attractive for heuristic alternatives (see the last chart below).
The following two charts, constructed from data in the paper, summarize gross excess returns relative to capitalization-weighted indexes (upper chart) and gross Sharpe ratios (lower chart) for the alternative weighting strategies for both global and U.S. stocks over their respective sample periods. Differences in markets and/or sample periods may drive global-U.S. disparities.
What about implementation costs?


The next chart, also constructed from data in the paper, summarizes excess annual turnover relative to capitalization-weighted indexes for the alternative weighting strategies (based on annual rebalancing) for both global and U.S. stocks over their respective sample periods. Turnover is generally higher for optimization strategies (four on the right) than heuristic strategies (five on the left). The optimization strategies are therefore subject to relatively high trading frictions.

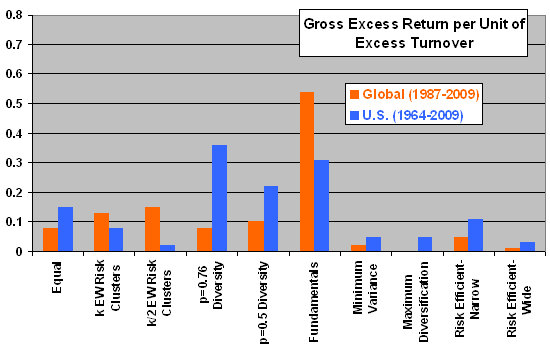
The final chart, also constructed from data in the paper, summarizes ratios of gross excess annual return to excess annual turnover (both relative to capitalization-weighted indexes) for alternative weighting strategies for both global and U.S. stocks over their respective sample periods. Results suggest that weighting on fundamentals may be the most cost-effective of the alternative strategies (highest net return).

In summary, evidence from backtesting of popular alternative passive indexing strategies indicates that they outperform capitalization weighting largely by exploiting the value premium and size effect, and that weighting on fundamentals may be best of breed.