How can investors easily estimate the degradation from optimized in-sample Sharpe ratio to out-of-sample expected Sharpe ratio? In their February 2016 paper entitled “Noise Fit, Estimation Error and a Sharpe Information Criterion”, Dirk Paulsen and Jakob Sohl derive a simple correction for the upward bias in an optimized in-sample Sharpe ratio. The upward bias derives from fitting: (1) random noise within the backtest sample; and, (2) peculiarities in the backtest sample that make it less than perfectly representative of the entire (unknowable) series. In other words, even if no predictability exists, fitting noise “discovers” some. And, even if predictability exists, predictability within a backtest sample will likely be different from predictability in the entire series. Based on derivations addressing quantification of these two sources of bias, they conclude that:
- The relationship between in-sample optimized Sharpe ratio (SRis) and associated expected out-of-sample Sharpe ratio (SRoos) is:
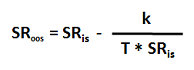
where:
– k is the number of parameters manipulated to achieve optimization, such as the weights for k+1 assets in a portfolio (one of the weights is redundant), and
– T is the length of the in-sample backtest (in years for an annualized Sharpe ratio).
- For example, if the optimized weights for a portfolio of six assets produce an annual Sharpe ratio of 2.0 over a backtest sample of ten years, the expected out-of-sample Sharpe ratio for for the portfolio is 2.0 * (1 – 5/10) = 1.0.
- An investor can therefore seek a high expected out-of-sample Sharpe ratio via a backtest that:
- Discovers a high in-sample Sharpe ratio.
- Limits the number of parameters manipulated during in-sample optimization.
- Employs a long sample period.
In summary, mathematical derivation indicates that expected out-of-sample Sharpe ratio increases with in-sample optimized Sharpe ratio, decreases with model complexity (number of parameters manipulated during optimization) and increases with in-sample backtest length.
Cautions regarding conclusions include:
- The use of Sharpe ratio for investment performance measurement assumes tame (normal) return distributions. For wild return distributions, it loses meaning.
- Long backtest samples may not be available for innovative strategies.
- Very simple strategies may not support high in-sample Sharpe ratios.