After seeing “Review of the Quantified Market Psychology Strategy”, reader Steve Ruoff requested review of his U.S. Treasuries timing strategy as recorded at Timertrac (Duration Strategy), which approximately every four weeks generates allocations to: Direxion Daily 7-10 Year Treasury Bull 3X Shares (TYD); Direxion Daily 7-10 Year Treasury Bear 3X Shares (TYO); and cash, for which we use SPDR Bloomberg 1-3 Month T-Bill ETF (BIL). Strategy inputs encompass:
- Current economic activity, inflation metrics and monetary policy factors.
- Valuation estimates focused on long-term mean reversion thresholds.
- Technical rules focused on price momentum.
To investigate, we download the Timertrac trade history for the Duration Strategy and replicate its performance using the selected exchange-traded funds (ETF). We look at average trading activity, average trade return, standard deviation of trade returns, trade reward/risk (average return divided by standard deviation), compound annual growth rate (CAGR) and maximum drawdown (MaxDD) at the trade frequency. We look at buying and holding iShares 7-10 Year Treasury Bond ETF (IEF) as an alternative and also look at buying and holding SPDR S&P 500 ETF Trust (SPY). Using the Duration Strategy trade history and daily adjusted opening prices for all specified ETFs during mid-January 2014 through early March 2024, we find that:
Because Duration Strategy trade history timestamps are at different times of the day and sometimes on weekends, we assume all trades occur at the next market open. Three pairs of trades have near-identical timestamps, so we ignore the earlier ones and use the later ones in all three cases. We began testing with the next open after the first allocation (1/19/2014) and end with the next open after the last allocation (3/8/2024). Initially, we ignore trading frictions.
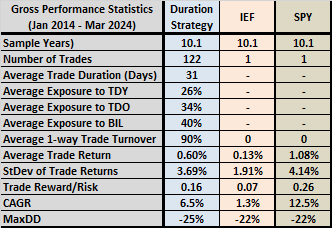
The following table presents full-sample gross performance statistics for the Duration Strategy, which trades monthly on average. It includes results for buying and holding IEF and SPY. On average, the Duration Strategy tilts a little short over the sample period. Based on gross findings, most investors would prefer the Duration Strategy to IEF, and SPY to the Duration strategy.
The Duration Strategy has high turnover, making it very sensitive to trading frictions, such that net performance could be materially worse than gross performance (see below).
For perspective, we look at cumulative performance.
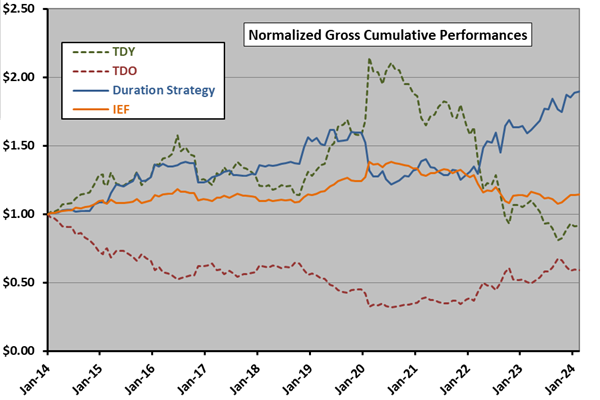
The following chart tracks gross value of a $1.00 initial investment in the Duration Strategy over the full sample period. For comparison, it tracks initial $1.00 investments in buying and holding, TDY, TDO and IEF. Notable points are:
- The Duration strategy mostly follows the desirable trends of TDY and TDO.
- However, the Duration Strategy is wrong-footed at the onset of the COVID-19 pandemic.
How sensitive is the Duration Strategy to trading frictions?
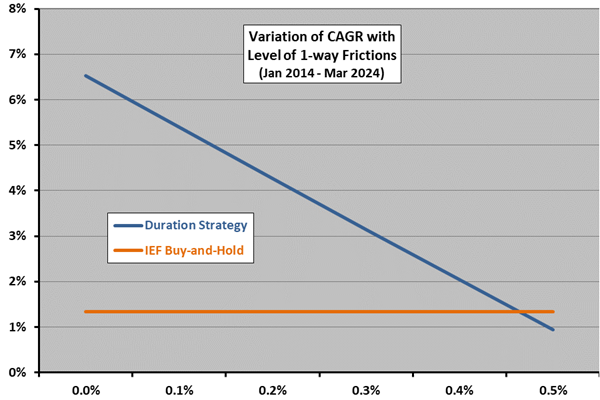
The final chart shows effects of imposing trading frictions of 0.1% to 0.5% on Duration Strategy CAGR, with buying and holding IEF as the benchmark. Because of high turnover, strategy CAGR declines steeply with frictions. For example, imposing 0.1% frictions lowers CAGR from 6.5% to 5.4%. Breakeven frictions relative to buying and holding IEF are between 0.4% and 0.5%. TDY and TDO are not particularly liquid.
In summary, evidence indicates that the Duration Strategy is an effective way to time interest rate trends as manifested in prices of U.S. Treasuries for investors who can achieve low trading frictions.
Cautions regarding findings include:
- Steve Ruoff reports that his actual implementation of the Duration Strategy is via U.S. Treasuries futures contracts (to achieve low frictions), with strict regularity and risk management (stop-losses).
- Some other benchmark that is U.S. Treasuries market-neutral would be appropriate, but also may be difficult to implement.
- There may be tax implications of trading.
- Duration Strategy details are proprietary, such that investors seeking to track it would bear fees for assistance from an advisor.
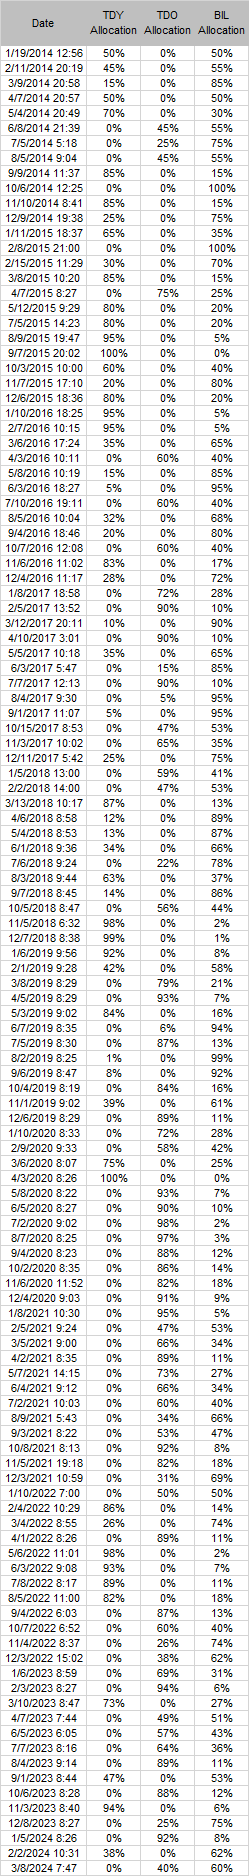
In case the Timertrac medallion stops working, the following table provides the trade history used above.