In response to “Optimal Monthly Cycle for Simple Asset Class ETF Momentum Strategy?”, a subscriber asked about the optimal monthly cycle for “Simple Sector ETF Momentum Strategy”, which each month allocates all funds to the one of the following nine Select Sector Standard & Poor’s Depository Receipts (SPDR) exchange-traded funds (ETF) with the highest total return over the past six months :
Materials Select Sector SPDR (XLB)
Energy Select Sector SPDR (XLE)
Financial Select Sector SPDR (XLF)
Industrial Select Sector SPDR (XLI)
Technology Select Sector SPDR (XLK)
Consumer Staples Select Sector SPDR (XLP)
Utilities Select Sector SPDR (XLU)
Health Care Select Sector SPDR (XLV)
Consumer Discretionary Select SPDR (XLY)
To investigate, we compare 21 variations of the strategy based on shifting the monthly return calculation cycle relative to trading days from the end of the month (EOM). For example, an EOM+5 cycle ranks assets based on closing prices five trading days after EOM each month. Using daily dividend-adjusted closes for the sector ETFs from mid-January 1999 through mid-July 2014 (about 186 months), we find that:
Specific trading assumptions are:
- Reallocate/rebalance at the close on the specified day of each month (assume that total six-month past returns for the ETFs can be calculated just before the close).
- Trading (switching) friction is 0.25% of the balance whenever there is a change in holdings.
- Ignore any tax implications of trading.
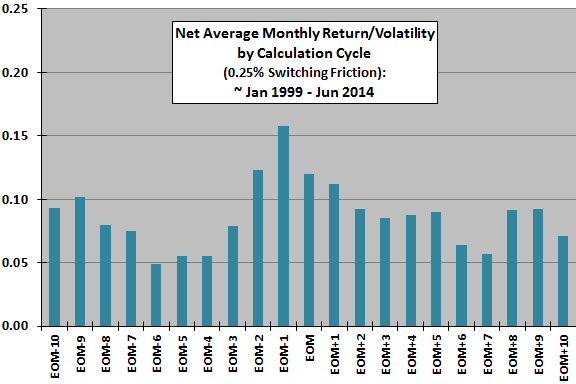
The following chart compares net average monthly returns divided by volatilities (standard deviations) of monthly returns for all 21 variations of the monthly calculation cycle. Ratios range from 0.05 for EOM-6 to 0.16 for EOM-1. The average (median) return-to-volatility ratio across all variations is 0.09 (0.09). The ratio for the EOM cycle is 0.12.
While slight differences in start and stop dates explain some differences in results, the large observed differences derive principally from noisy signals or from some persistent monthly cycle in investor behavior. To the extent persistent investor behavior (such as the turn-of-the-month effect for U.S. stocks) drives variation, a calculation cycle based on the day before EOM is most attractive. To the extent noise drives the variation, findings expose a discomforting caution that this intense data snooping can drive large cumulative bias over many-period backtests.
For another perspective, we compare net terminal values.
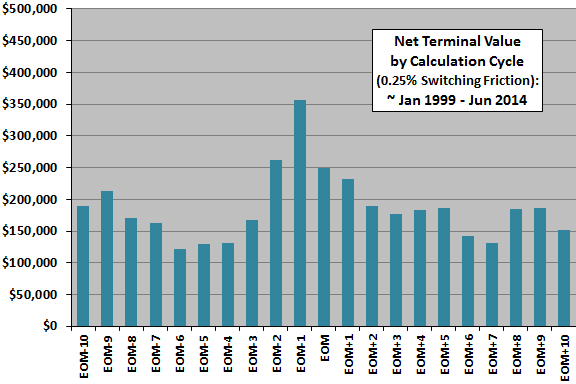
The next chart compares net terminal values of $100,000 initial investments for all 21 variations of the monthly calculation cycle.
Terminal values range from $121,193 for EOM-6 to $356,594 for EOM14. The average (median) terminal value across all variations is $186,497 ($182,547). The terminal value for the EOM cycle is $248,730. Again, slight differences in start and stop dates explain some differences in results. However, the large observed differences are likely due to (unexploitable) noisy signals or to a persistent (exploitable) monthly cycle in investor behavior.
Results are quite different from those in “Optimal Monthly Cycle for Simple Asset Class ETF Momentum Strategy?”.
For greater depth of perspective, we compare net cumulative trajectories.
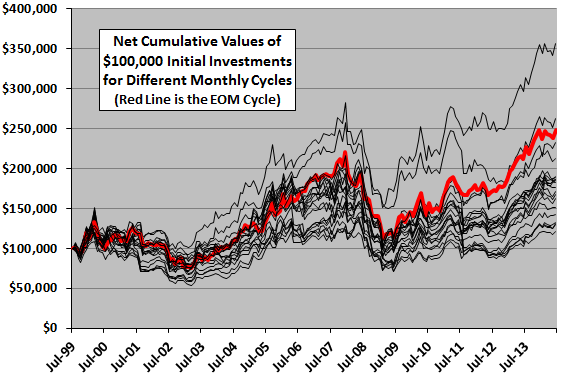
The final chart tracks net cumulative values of a $100,000 initial investments for all 21 variations of the monthly calculation cycle over the available sample period. For this comparison, we align the slightly different start and stop dates. The heavy red line is the trajectory of the EOM cycle.
The chart emphasizes the large cumulative effects of varying the monthly calculation cycle. Again, slight differences in start and stop dates explain some differences in trajectories. However, the large observed differences are likely due to (unexploitable) noisy signals or to a persistent (exploitable) monthly cycle in investor behavior.
Maximum drawdowns do not vary greatly for the 21 variations, ranging from -42% for EOM-2 to -55% for EOM+10. The average (median) maximum drawdown across all variations is -50% (-50%). The maximum drawdown for the EOM cycle is -49%.
In summary, evidence suggests the possibility that the optimal monthly calculation cycle for the Simple Sector ETF Momentum Strategy is the day before the end of the month.
To the extent that some persistent calendar effect drives differences in outcomes, an investor using the strategy may want to perform monthly calculations the day before EOM. To the extent that differences in outcomes derive from randomness, an investor using the strategy would most rationally expect the average or median outcome (while prepared for worst case).
Cautions regarding findings include:
- The sample period is short for assessing sources of differences in outcomes.
- As noted, brute force experimentation introduces data snooping bias. The performance of the best (worst) variation tends to overstate (understate) expected performance of the strategy. Daily data is especially noisy and subject to snooping bias.
- Backtesting and tracking monthly adjusted return cycles other than that based on EOM is cumbersome.