
A subscriber requested evaluation of three retirement investment alternatives, assuming a constant increment invested at the end of each month, as follows:
- 50-50: allocate each increment via fixed percentages to stocks and bonds (for comparability, we use 50% to each).
- Seasonal 1: during April through September (October through March), allocate 100% of each increment to stocks (bonds).
- Seasonal 2: during April through September (October through March), allocate 100% of each increment to bonds (stocks).
The hypothesis is that seasonal variation in asset class allocations could improve overall long-term investment performance. We conduct a short-term test using SPDR S&P 500 ETF Trust (SPY) as a proxy for stocks and iShares iBoxx $ Investment Grade Corporate Bond ETF (LQD) as a proxy for bonds. We then conduct a long-term test using Vanguard 500 Index Fund Investor Shares (VFINX) as a proxy for stocks and Vanguard Long-Term Investment-Grade Fund Investor Shares (VWESX) as a proxy for bonds. Based on the setup, we focus on terminal value as the essential performance metric. Using total (dividend-adjusted) returns for SPY and LQD since July 2002 and for VFINX and VWESX since January 1980, all through December 2020, we find that:
For simplicity, we assume the monthly investment increment is $1. We ignore the assumption in some retirement analyses that monthly investment increment increases annually with inflation. We also ignore any frictions involved in buying funds. These simplifications are likely immaterial for comparing similar strategies.
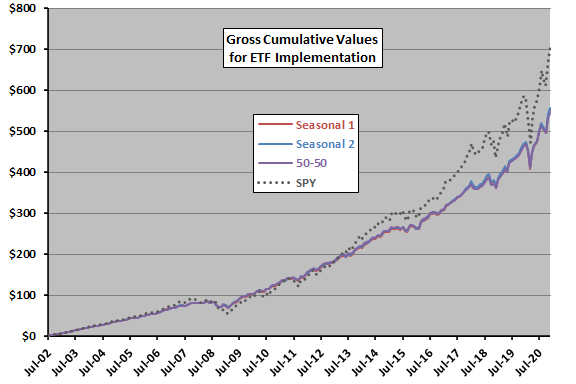
The following chart tracks cumulative values of the three strategies specified above as applied to SPY and LQD, along with that for buying SPY alone. Notable points are:
- Differences among the three allocation strategies are slight. Terminal values of Seasonal 1, Seasonal 2 and 50-50 are $551, $555 and $544.
- Contributions from stocks (bonds) are $351 ($201) for Seasonal 1 and $354 ($201) for Seasonal 2.
- Concentrating holdings in SPY wins, with terminal value $705 (but with deeper drawdowns).
Next, we test mutual funds over a longer sample period.
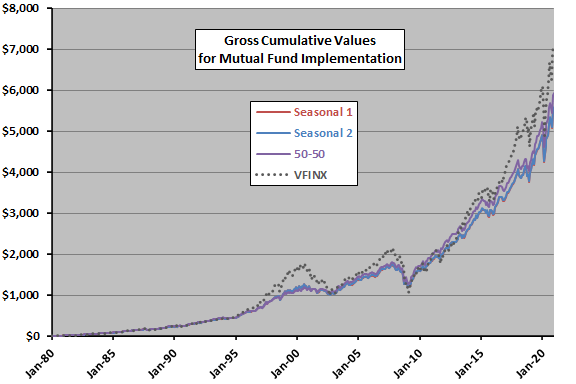
The next chart tracks cumulative values of the three strategies specified above as applied to VFINX and VWESX, along with that for buying VFINX alone. Notable points are:
- Differences among the three allocation strategies are small, but 50-50 offers a material advantage. Terminal values of Seasonal 1, Seasonal 2 and 50-50 are $5,575, $5,593 and $5,922.
- Contributions from stocks (bonds) are $3,543 ($2,032) for Seasonal 1 and $3,553 ($2,040) for Seasonal 2.
- Concentrating holdings in VFINX wins, with terminal value $7,096 (but with deeper drawdowns).
In summary, evidence from simple tests does not support belief that seasonal timing of monthly investment increments improves long-term (e.g., retirement) investment performance.
In other words, long-term compounding effects on past increments dominate any seasonal timing effects on new increments for these setups.
Cautions regarding findings include:
- Compared to buying only stocks, results are sensitive to proximity of start date to stock market crashes.
- Sample periods are largely periods of declining interest rates and rising bond prices.
- Testing multiple strategies on the same sample introduces data snooping bias, such that the best-performing alternative overstates expectations.
Frequently Asked Questions
What is seasonal timing of monthly investment contributions in a retirement portfolio?
Seasonal timing of monthly investment contributions is a strategy that shifts each month's new retirement contribution between stocks and bonds depending on the calendar season. One version puts 100% of each increment in stocks from April through September and in bonds from October through March, and another reverses that pattern. The goal is to improve long-term performance compared with a fixed allocation such as 50% stocks and 50% bonds.
Does seasonal timing of monthly contributions improve long-term retirement investment performance?
Seasonal timing of monthly contributions did not materially improve long-term performance compared with a fixed 50-50 stock-bond allocation. For SPY and LQD (2002-2020), terminal values were $551 and $555 for the two seasonal strategies versus $544 for 50-50. For VFINX and VWESX (1980-2020), they were $5,575 and $5,593 versus $5,922 for 50-50, which gave a material advantage.
How do you test seasonal allocation strategies for monthly retirement investments?
Seasonal allocation strategies are tested by investing a constant $1 increment at the end of each month and comparing the terminal value of each strategy. The short-term test uses total returns on SPY (stocks) and LQD (bonds) from July 2002 through December 2020. The long-term test uses VFINX (stocks) and VWESX (bonds) from January 1980 through December 2020, and the tests ignore inflation adjustments to contributions and fund trading frictions.
How does a fixed 50-50 stock-bond allocation compare to seasonal switching or an all-stock portfolio?
A fixed 50-50 allocation performed about the same as seasonal switching in the SPY/LQD test ($544 versus $551 and $555) and better in the VFINX/VWESX test ($5,922 versus $5,575 and $5,593). Holding only stocks produced the highest terminal values ($705 for SPY and $7,096 for VFINX), but with deeper drawdowns. The article attributes the small differences among allocation strategies to long-term compounding of past increments dominating seasonal timing effects on new increments.
What are the limitations of backtesting seasonal stock-bond allocation strategies?
Backtests of seasonal stock-bond allocation strategies have several limitations. Results versus an all-stock portfolio are sensitive to how close the start date is to stock market crashes. The sample periods were largely periods of declining interest rates and rising bond prices. Testing multiple strategies on the same sample also introduces data snooping bias, so the best-performing alternative overstates expectations.