Does the January (turn-of-the-year) stock return anomaly affect value and momentum strategies applied at the country stock market level? In his June 2015 paper entitled “The January Seasonality and the Performance of Country-Level Value and Momentum Strategies”, Adam Zaremba investigates this question using four value and two momentum firm/stock metrics. The four value metrics, each measured over four prior quarters with a one-quarter lag and weighted by company according to the methodology of the associated stock index, are:
- Earnings-to-price ratio (EP).
- Earnings before interest, taxes, depreciation and amortization (EBITDA)-to-enterprise value (EV) ratio (EBEV).
- EBITDA-to-price ratio (EBP).
- Sales-to-EV ratio (SEV).
The two momentum metrics are:
- Stock index return from 12 months ago to one month ago (LtMom).
- Stock index return from 12 months ago to six months ago (IntMom).
He assesses strategy performance via returns in U.S. dollars in excess of one-month U.S. Treasury bill yield from hedge portfolios that are each month long (short) the equally weighted fifth of country stock indexes with the highest (lowest) expected returns based on each metric. He first reviews performances for all months and then focuses on turn-of-the-year (December and January) performances. Using monthly data for 78 existing and discontinued country stock market indexes during June 1995 through May 2015, he finds that:
- Based on all months:
- Country-level value strategies generally work. Gross average monthly hedge portfolio returns range 0.32 to 0.96 and annualized Sharpe ratios 0.28 to 0.79 (EBEV is highest).
- Country-level momentum strategies generally work. Gross average monthly hedge portfolio returns are 0.64 and 0.74, and annualized Sharpe ratios are 0.47 and 0.74 (IntMom is higher).
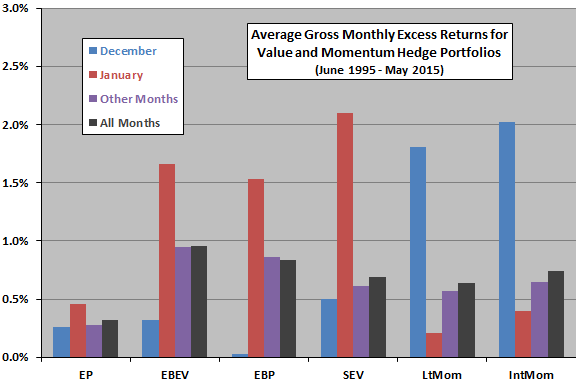
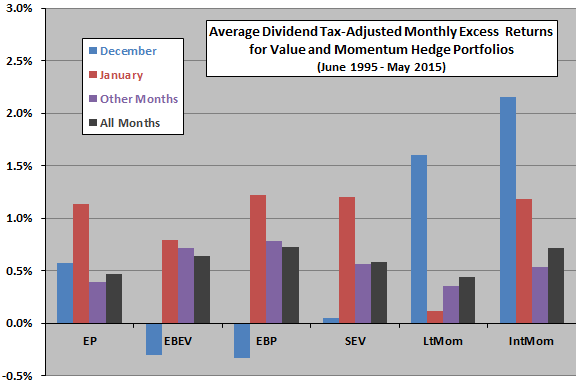
- Around the turn-of-the-year (see the charts below):
- Value strategies perform well in January and poorly in December, but statistical significance is weak.
- Momentum strategies perform well in December and poorly in January, but statistical significance is again weak.
- Results are consistent with tax loss selling and window dressing.
The following charts, constructed from data in the paper, summarize average monthly excess returns for hedge strategies that are each month long (short) the equally weighted fifth of country stock indexes with the highest (lowest) expected returns based on each of the six value and momentum metrics over the entire sample period. The upper (lower) chart presents gross (dividend tax-adjusted) excess returns. Results suggest that, at the country level:
- EBEV or EBP is the best value strategy.
- IntMOM is preferable to LtMom.
- Value underperforms in December and outperforms in January.
- Momentum outperforms in December and underperforms in January.
However, the sample period is short for analysis of calendar effects, and turn-of-the-year effect findings are statistically weak.


In summary, evidence from available data indicates weakly that value underperforms (momentum outperforms) in December and outperforms (underperforms) in January at the country stock market level.
Cautions regarding findings include:
- As noted in the paper, the short available sample period (which includes the very unusual and statistically disruptive 2008 financial crisis) works against confidence in findings.
- Return calculations are for indexes, which do not account for costs of maintaining actual liquid funds. These costs vary by country, such that actual fund rankings on momentum metrics may differ from index rankings.
- As noted in the paper, calculations ignore (1) trading frictions for monthly hedge portfolio reformation and (2) regulatory barriers to capital movement across countries, thereby overstating returns.