In mid-2008, a reader speculated and asked: “You have probably heard of the historical 6:1 crude oil/natural gas price ratio. This relationship is said to be mean reverting based on the thermal equivalence of the two commodities. Does this ratio have any predictive power for the future prices of oil or natural gas? If there is no predictive power for this ratio, then it could mean that the thermal equivalence itself shifts over time. And hedge funds who are long natural gas right now are making a huge fundamental mistake.” If there are relationships, we hypothesize that a high (low) crude oil-natural gas price ratio should predict future changes in the prices of natural gas of crude oil to decrease (increase) the ratio. Using the monthly composite U.S. refiner cost of crude oil (nominal dollars per barrel) and the monthly U.S. wellhead natural gas price (nominal dollars per thousand cubic feet) for January 1976 through June 2012 (438 months), we find that:
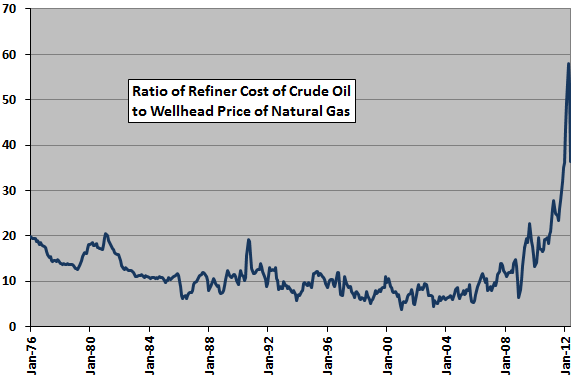
The following chart plots the crude oil-natural gas spot price ratio based on monthly data over the sample period. The average value of the ratio is 11.9, with standard deviation of monthly values 6.2. The range is 3.7 (January 2001) to 58 (April 2012). Visual inspection indicates no obvious reversion level or cycle. Recently high values are obvious, attributable perhaps to a combination of technological innovation, profit margins and regulatory pressures (rather than shifts in thermal equivalence).
For precision, we relate the ratio to monthly changes in spot prices to identify lead-lag patterns.

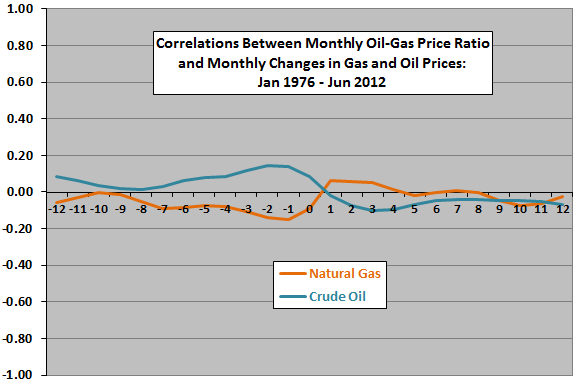
The next chart summarizes Pearson correlations over the sample period between monthly crude oil-natural gas spot price ratio and monthly changes in spot prices for relationships ranging from spot price changes lead the ratio by 12 months (-12) to the ratio leads spot price changes by 12 months (12). Results suggest that:
- Reasonably, when crude oil spot price increases (decreases) in past months, the ratio tends to be somewhat high (low). Symmetrically, when natural gas spot price increases (decreases) in past months, the ratio tends to be somewhat low (high).
- When the ratio is high (low), natural gas spot price has a slight tendency to increase (decrease) over the next three months.
- When the ratio is high (low), crude oil spot price has a slight tendency to decrease (increase) over several future months.
For further analysis, we focus on the 3-month future change in natural gas spot price.

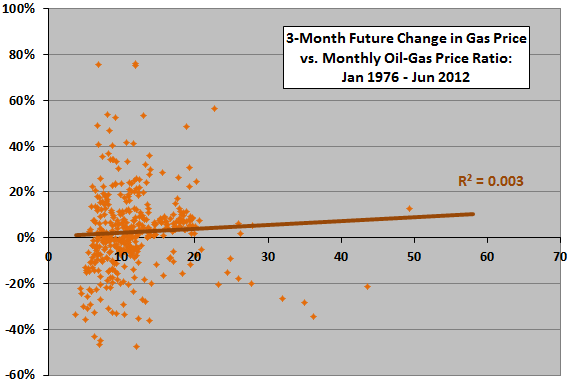
The following scatter plot relates 3-month future change in natural gas spot price to monthly crude oil-natural gas price ratio over the sample period. The Pearson correlation for the two series is 0.05 and the R-squared statistic is 0.003, indicating that the ratio explains less than 1% of the variation in natural gas price the next quarter.
Overlap of price change intervals can distort statistics, and there may be a material non-linearity in the relationship. To address these concerns, we winnow the sample and calculate natural gas price changes by range of the ratio.

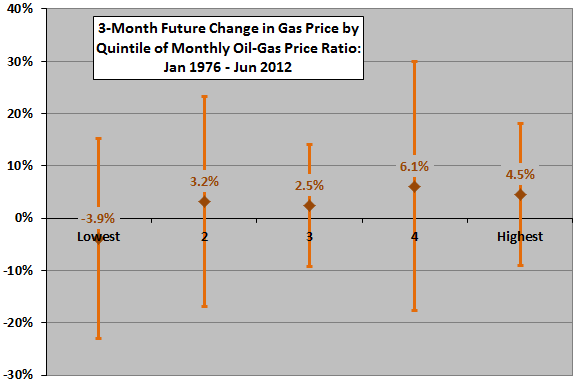
The final chart summarizes 3-month future change in natural gas spot price by ranked fifth (quintile) of crude oil-natural gas spot price ratio over the sample period, with one standard deviation variability ranges. Winnowing the sample such that price change intervals do not overlap leaves only 29 observations per quintile.
Variations in average price change and associated volatility by quintile of the ratio are not systematic, undermining belief in a reliable relationship.
Given the high monthly volatility of natural gas spot price, the number of observations by quintile is small for useful inference.

Regarding the speculation that hedge funds long natural gas in mid-2008 “are making a huge fundamental mistake,” natural gas spot price falls 76% from the end of July 2008 through June 2012, while the crude oil-natural gas spot price ratio never falls below 6. During August 2011 through April 2012, with the crude oil-natural gas spot price ratio between 23 and 58, natural gas price falls by 55%.
In summary, evidence from simple analyses suggests that the crude oil-natural gas spot price ratio has little or no useful predictive power for natural gas spot price at testable horizons.
Cautions regarding findings include:
- As noted, the high monthly volatility of energy commodity spot prices limits reliability of statistical inference.
- The behavior of commodity futures contract prices may be different from that of spot prices.