How should investors think about investing in crude oil? In their June 2016 paper entitled “Understanding Oil Investing”, Ludwig Chincarini, John Love and Robert Nguyen examine oil investing, with emphasis on differences in behaviors between non-investable spot oil and investable crude oil futures. They consider several approaches to futures, all fully collateralized by cash (one-month U.S. Treasury bills):
- Simple systematic rolling – Select a contract series (nearest, 2nd, 3rd… from expiration) and systematically roll from one contract in the series to the next at a specified time before expiration (0, 1, 3, 5, 10, 13… days).
- Binary signaled rolling (Strategy 1) – Acquire/roll to the next contract in a series only when the series is in backwardation (has positive roll yield) and otherwise hold cash.
- Highest roll yield (Strategy 2) – Acquire/roll to the one of the nearest, 2nd or 3rd contract with the highest backwardation (or lowest contango) on a specified roll date.
They also examine the behaviors of crude oil exchange-traded funds (ETF). Using daily spot West Texas Intermediate (WTI) crude oil price and WTI crude oil futures prices, volumes and open interest during 1983 through 2015 (focusing on 1994-2015 and 2005-2015), and crude oil ETF prices from inceptions through early 2016, they find that:
- Asset allocation studies that use spot oil price give oil more importance than it should have relative to other commodities and other asset classes.
- Over the last 20 years, the crude oil futures term structure shifts from backwardation to contango, introducing a drag on simple systematic rolling.
- During 1994-2015, the average gross annualized return for always rolling to the nearest contract ranges from 6.6% to 11.0% (depending on roll date), generally outperforming spot oil. For example, rolling the nearest contract at expiration outperforms spot oil by an average 1.9% per year.
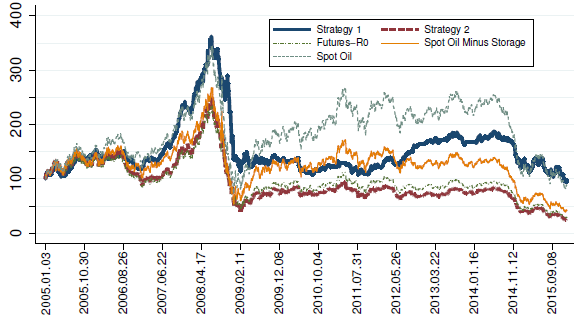
- During 2005-2015 (see the chart below), crude oil futures are in contango most of the time and the average gross annualized return for always rolling to the nearest contract ranges from -4.8% to -9.0% (depending on roll date), generally underperforming spot oil. For example, rolling the nearest contract at expiration underperforms spot oil by an average -9.2% per year.
- This regime shift also affects performance of conditional Strategies 1 and 2 above.
- During 1994-2015 (2005-2015), the average gross annualized return for binary signaled rolling to the nearest contract at expiration generates average gross annualized return 21.8% (2.4%) and gross annualized Sharpe ratio 0.76 (0.05).
- During 1994-2015 (2005-2015), the average gross annualized return for rolling at expiration to the contract with the highest roll yield generates average gross annualized return 10.2% (-6.0%) and gross annualized Sharpe ratio 0.22 (-0.20).
- Futures strategies have the greatest exposure to oil. Investment vehicles that hold oil stocks (such as industry ETFs) do not track oil well and entail other risks.
- The ETF that tracks oils most closely is United States Oil (USO), which invests directly in crude oil futures.
- The iPath S&P GSCI Crude Oil Total Return ETN (OIL) seeks to replicate the total return of S&P Goldman Sachs Commodity Index Crude Oil, which is based on futures, and tracks oil nearly as well as USO.
- The PowerShares Deutsche Bank Oil Fund (DBO) seeks to mitigate contango drag by
rolling to the optimal futures contract and outperforms USO. - USL seeks to seeks to mitigate contango drag by investing in multiple futures durations up to one year and also outperforms USO.
- None of the oil ETFs outperform spot oil or a simple futures-based benchmark.
The following chart, taken from the paper, compares normalized gross cumulative returns during 2005-2015 for five series:
- Strategy 1 as described above and applied to the nearest crude oil futures contract series rolled when signaled at expiration.
- Strategy 2 as described above and applied to the first three crude oil futures contract series rolled at expiration.
- Simple systematic rolling to the nearest crude oil futures contract at expiration (Futures-R0).
- Spot crude oil (not investable).
- Spot crude oil minus $0.40 per barrel per month to account for estimated storage costs.
Results show that none of the series are attractive over the entire period and that spot performance overstates expectations for much of the period relative to investable alternatives.

In summary, evidence indicates that: (1) spot crude oil performance is a poor benchmark for financial investment in oil; and, (2) investing in crude oil only when futures are in backwardation may be a relatively good approach.
Cautions regarding findings include:
- Results do not account for any frictions associated with rolling crude oil futures contracts. These frictions would reduce returns for direct investment in futures.
- As shown, crude oil has been a poor standalone investment in recent years.