Are commodity futures an attractive asset class over the long run? In their October 2016 paper entitled “Commodities for the Long Run”, Ari Levine, Yao Hua Ooi and Matthew Richardson analyze commodity futures prices extending as far back as 1877. Their perspective is that futures price reflects both foregone interest and cost of storage for holding a commodity, with these costs potentially offset by a convenience yield associated with potential shortages of the commodity. They therefore decompose futures return into spot return in excess of cash (spot return minus short-term interest rate) and net convenience yield (roll yield plus short-term interest rate) rather than simple spot return and simple roll yield. The excess spot return represents a spot commodity risk premium, while the net convenience yield represents compensation for bearing inventory risk and/or providing liquidity to hedgers. They also report simple spot return and simple roll yield for comparison. They construct commodity futures indexes by, in general, each month holding the nearest contracts with delivery at least two months away. They examine commodity futures return behaviors during backwardation versus contango, and across business and inflation cycles. They compare commodity futures return behaviors to those of excess total returns on the aggregate U.S. stock market and long-term U.S. government bonds, and extend this analysis to consider the impacts of commodity futures on a diversified portfolio. Using monthly prices for 35 commodity futures (18 agricultural, 6 energy, 11 metals) as available, along with data for U.S. government bonds, the U.S. stock market and the U.S. economy, during 1877 through 2015, they find that:
- Data commence with 10 (all agricultural) contract series starting in 1877 through the 1950s. Eight, four, five and eight additional series start during the 1960s, 1970s, 1980s and 1990s, respectively. Two early series end during the 1920s.
- For individual commodity series, 31 of 35 have positive average annual returns, and net convenience yield is higher than excess spot return for 21 of 35. Short-term interest rates are the main driver of the convenience yield.
- Based on the average condition across commodities, backwardation occurs 47% of the time, with average value 0.90% and average duration 4.4 months before switching to contango.
- For an equally weighted, monthly rebalanced index of all commodity futures (see the charts below):
- Average annual return for the full sample is 4.8%, with annual volatility 17.6%. Average annual excess spot return and net convenience yield are 2.1% and 3.9%, respectively. Average annual return for 1877-1945 (1946-2015) is 3.8% (5.8%).
- Geometric mean annual return for the full sample is 3.3%, with excess spot return and net convenience yield 0.4% and 3.8%, respectively. Geometric mean return for 1877-1945 (1946-2015) is 1.7% (4.9%).
- Results for an equal-risk index are similar.
- Commodity futures returns vary significantly across economic/market states, mostly due to variation in spot prices. Specifically, the equally weighted index generates annualized average return:
- 7.9% (1.5%) during futures backwardation (contango) as defined above.
- 14.1% (-4.5%) during in high (low) inflation, offering a hedge against high inflation.
- 8.9% (-7.3%) during economic expansions (contractions).
- Based on carry, value and momentum, commodity futures index returns are somewhat predictable at a 1-month horizon, but less so at 1-year and 5-year horizons.
- Commodity futures returns have low correlations with those of the U.S. stock market and long-term U.S. government bonds, thereby offering portfolio diversification. Over the full sample period with monthly rebalancing:
- The mean-variance optimal portfolio allocates (retrospectively) 29% to stocks, 54% to government bonds and 17% to commodities.
- The optimal portfolio, an equally weighted portfolio, a 60%/40% stocks/bonds portfolio and a 54%/36%/10% stocks/bonds/commodities portfolio have gross annual Sharpe ratios 0.48, 0.45, 0.42 and 0.45, respectively.
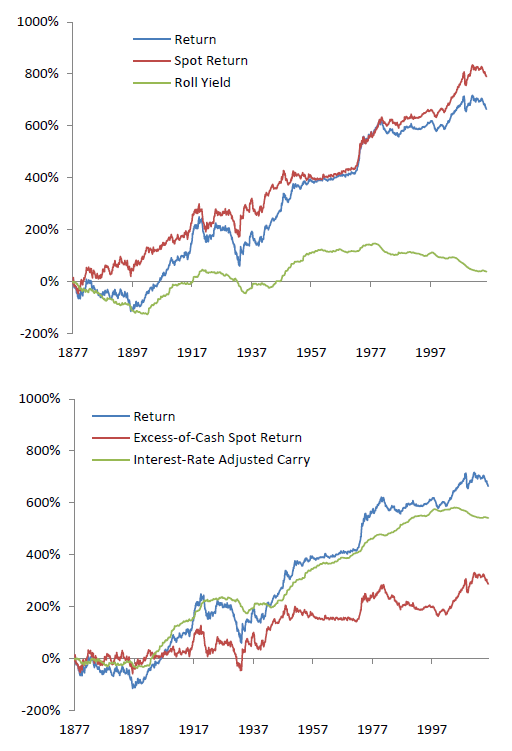
The following charts, taken from the paper, track cumulative return (Return) of an equally weighted index of all commodity futures as available, rebalanced monthly. The upper chart shows conventional spot return and roll yield components of this return. The lower chart shows excess spot return (Excess-of-Cash Spot Return) and net convenience yield (Interest Rate-Adjusted Carry) components featured in the paper. Results indicate that:
- The commodity futures index exhibits large swings, with long subperiods of flat or negative returns.
- For the conventional breakdown, spot return dominates roll yield (which is close to zero).
- For the excess spot return/net convenience yield breakdown, the latter dominates. In other words, short-term interest rates are important to interpretation of commodity returns.
Results for an equal risk index are similar.
In summary, evidence suggests that commodity futures may add value to a diversified portfolio of stocks and bonds.
Cautions regarding findings include:
- As noted, agricultural products dominate more than half the sample period, undermining representation as “commodities” for the long run.
- Analyses of commodity futures index performance during different market states is retrospective, explicitly exploitable only for an investor who can predict the states.
- Portfolio performance calculations use indexes rather than tradable assets, thereby ignoring costs of maintaining a liquid fund (including in this case monthly rebalancing). These costs would reduce performance. Costs likely vary considerably over time and may be very high during long subperiods.
- Portfolio performance calculations ignore costs of monthly rebalancing.