“Chicago Fed ANFCI as U.S. Stock Market Predictor” suggests that weekly change in the Federal Reserve Bank of Chicago’s Adjusted National Financial Conditions Index (ANFCI) may be a useful indicator of future U.S. stock market returns. We test its practical value via two strategies that are each week in SPDR S&P 500 (SPY) when prior change in ANFCI is favorable and in cash (U.S. Treasury bills, T-bills) when prior change in ANFCI is unfavorable, as follows:
- Change in ANFCI < Mean [aggressive]: hold SPY (cash) when prior-week change in ANFCI is below (above) its mean since the beginning of 1973, providing an initial 20-year calculation interval.
- Change in ANFCI < Mean+SD [conservative]: hold SPY (cash) when prior-week change in ANFCI is below (above) its mean plus one standard deviation of weekly changes in ANFCI since the beginning of 1973.
The return week is Wednesday open to Wednesday open (Thursday open when the market is not open on Wednesday) per the ANFCI release schedule. We assume SPY-cash switching frictions are a constant 0.1% over the sample period. We use buying and holding SPY as the benchmark. Using weekly levels of ANFCI since January 1973 and weekly dividend-adjusted opens of SPY and T-bills since February 1993 (limited by SPY), all through April 2020, we find that:
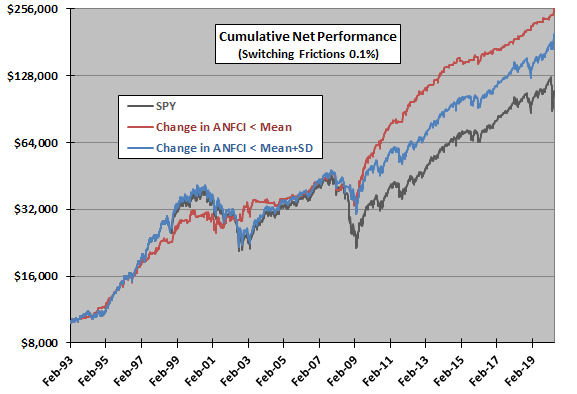
The following chart compares cumulative net values of $10,000 initial investments in the two market timing strategies and SPY over the available sample period. Notable points are:
- Both timing strategies outperform over the long run due to avoidance of some of the worst stock market returns.
- Only aggressive Strategy 1 avoids most of the 2001-2002 and 2008-2009 bear markets.
The sample is very small in terms of number of bear markets.
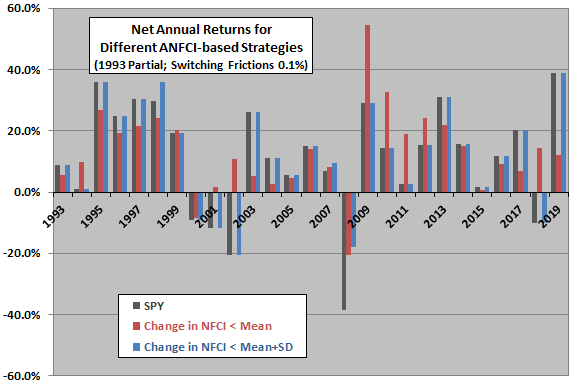
For perspective, we look at calendar year returns for the three strategies.
The next chart shows net annual returns of the two market timing strategies and SPY over the available sample period. Notable points are:
- Aggressive Strategy 1 bears fewer drawdowns than either SPY or the conservative strategy. It is in stocks only 50% of sample period weeks.
- Conservative Strategy 2 usually performs like the benchmark, with 2008 a notable exception (raising the possibility of fragile, one-off outperformance). It is in stocks during 98% of sample period weeks.
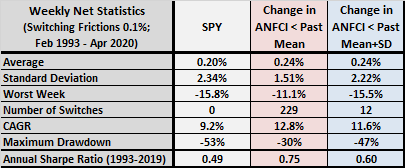
For deeper insight, we look at additional performance statistics.
The following table compares weekly net performance statistics for the benchmark and the two timing strategies, including: average weekly return; standard deviation of weekly returns; worst week; number of SPY-cash switches; compound annual growth rate (CAGR); maximum drawdown; and, annual Sharpe ratio using average weekly T-bill yield during a year as the risk-free rate and treating 1993 as a full year. Notable points are:
- Strategy 1 easily beats SPY but generates 229 switches and is hence sensitive to assumed level of switching frictions. It has the same CAGR as SPY for switching frictions 0.46%.
- Strategy 2 beats SPY by a lower margin and suffers a maximum drawdown almost as deep as SPY. However, it generates few switches and is therefore not sensitive to assumed level of switching frictions.
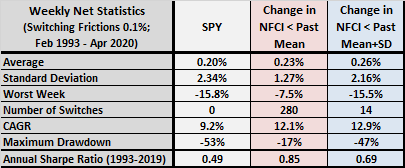
For reference the next table presents the same performance statistics from “Exploiting Chicago Fed NFCI Predictive Power”. Notable differences are:
- Strategy 1 works worse than above in terms of CAGR, but has a materially shallower maximum drawdown and higher Sharpe ratio.
- Strategy 2 works better than above based on both CAGR and Sharpe ratio.
In summary, evidence from simple strategy tests confirms that weekly changes in the ANFCI may be a useful for U.S. stock market timing, but perhaps not as useful as changes in the broader NFCI.
Cautions regarding findings include:
- The assumed level of switching frictions may be low for the early part of the sample period. Frictions mostly decline over this period.
- Tests ignore tax implications of trading.
- ANFCI volatility declines over its full sample period, such that the expanding window standard deviation of changes in ANFCI declines and percentage of time in stocks for Strategy 2 rises. A rolling window for calculating mean and standard deviation of changes in ANFCI would generate different results, but selecting the window invites data snooping bias.
- Return on cash may be overstated for timing strategy 1 due to very frequent switching and settlement delays. Assuming zero return on cash lowers Strategy 1 CAGR to 12.0% but does not affect CAGR for Strategy 2.
- As noted, outperformance of Strategy 2 derives almost entirely from 2008 and may therefore be fragile.
- The very complex and evolving nature (occasional model changes) of ANFCI raises suspicion of data snooping bias, such that predictive power of older data is overstated.
- ANFCI did not exist during most of the sample period (data are backfilled), and there is no feedback from the market for its publication until 2010.