Output gap (log industrial production deviation from linear-quadratic trend) is associated with future U.S. excess stock returns, with adjusted R-squared of 0.02, 0.05 and 0.11 at monthly, quarterly and annual horizons (1948–2005; in-sample and out-of-sample regressions).
Does any broad measure of the state of the economy meaningfully predict financial market returns? In their May 2008 paper entitled “Time-Varying Risk Premia and the Output Gap”, Ilan Cooper and Richard Priestley investigate the output gap as a direct link between future stock returns and economic fundamentals. They define output gap as the deviation of the log of industrial production from a trend constructed from both linear and quadratic components. Using unrevised industrial production data, aggregate U.S. stock market returns and Treasury bill yields (to calculate excess returns) for the period 1948-2005, they conclude that:
The output gap significantly predicts U.S. stock returns, most effectively at business cycle forecast horizons, both in-sample and out-of-sample.
The adjusted R-squared statistics for the historical relationship between output gap and U.S. stock returns are 0.02, 0.05 and 0.11 at monthly, quarterly and annual forecast horizons, respectively.
A one standard deviation decline in the output gap increases predicted annual excess U.S. stock returns by about 5%.
The output gap has predictive power for excess stock returns at business cycle and longer frequencies in most other G7 countries over the period 1970-2005.
The output gap has predictive power for excess U.S. government bond returns over the period mid-1952 through 2003.
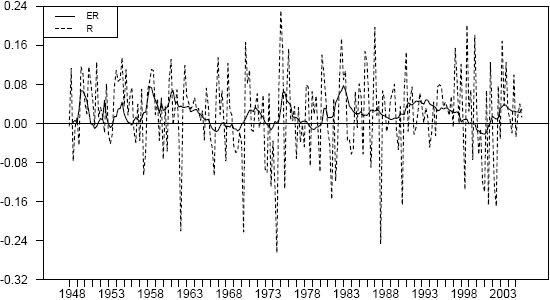
The following chart, taken from the paper, compares expected excess return (ER) for the broad U.S. stock market, as predicted by the output gap, to the actual excess return at a quarterly frequency. The predicted return series is much less volatile than actual returns.
In summary, while of little value to traders, the industrial production (output) gap may have some meaningful predictive power for broad U.S. stock returns over relatively long periods.
Yield Curve as a Stock Market Indicator Premium10-year T-note minus 3-month T-bill spread timing (monthly; SPY to cash when spread is over 1 SD below average) underperformed buy-and-hold SPY (CAGR 9.8%…
Growth-inflation Regimes and Asset Class Returns PremiumClaude-generated charts of annual SPY, TLT, VNQ, GLD and DBC returns across four growth-inflation regimes show no obvious patterns; stagflation favored TLT and GLD…
BTC Interactions with GLD, CPI and EFFR PremiumDoes bitcoin (BTC) return exhibit any exploitable leading or lagging roles with respect to gold (SPDR Gold Shares - GLD) return, change in the…
Recent Interactions of Asset Classes with Inflation (CPI) PremiumQuarterly change in NSA all-items CPI correlates negatively with ETF returns two to three quarters later for multiple asset classes, with long-term Treasuries and…
Testing Wilshire 5000/GDP as Stock Market Predictor PremiumW5000/GDP level and its changes (quarterly, 2- and 5-year average change, slopes) show small, mostly negative correlations with future Wilshire 5000 returns up to…