
Are equity investors on average irrationally afraid of market plunges, and therefore willing to overpay for index put options? In their October 2004 paper entitled “A Portfolio Perspective on Option Pricing Anomalies”, Joost Driessen and Pascal Maenhout investigate the benefits of index options positions to asset allocating investors. In the June 2007 version of their paper entitled “Understanding Index Option Returns”, Mark Broadie, Mikhail Chernov and Michael Johannes compare historical option returns to those generated by commonly used option pricing models. These studies find that:
“A Portfolio Perspective on Option Pricing Anomalies” measures index option returns using daily data for S&P 500 futures options from the Chicago Mercantile Exchange for the period January 1987 (including the 1987 crash) to June 2001. It focuses on two short-maturity strategies: (1) buying out-of-the-money (OTM) put options with 96% strike-to-spot ratio; and, (2) buying at-the-money (ATM) straddles. Both strategies trade at the turn of calendar months with closing residual maturities between eight weeks and two weeks (they do not hold to maturity).
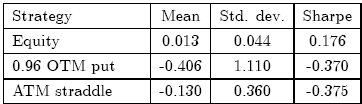
The following table, extracted from the paper, summarizes monthly results for the underlying S&P 500 index futures (Equity), the OTM puts and the ATM straddles across the entire sample period. The mean monthly return is +1.3% for the S&P 500 index futures, -41% for the put options and -13% for the option straddles. Selling the put options and straddles would therefore have generated positive returns as rewards for assuming volatility and jump risks. While the volatilities (standard deviations) of the options positions are much higher than the volatility of the underlying index futures, the magnitudes of the Sharpe ratios are still greater for the options.
The authors conclude that:
- The option positions are economically and statistically significant and robust to inclusion of transaction costs and margin requirements.
- Short put option and straddle positions should be attractive to most asset allocating investors.
- Only loss-averse investors who hold highly distorted probability beliefs would buy such puts and straddles as hedges.
“Understanding Index Option Returns” examines monthly returns for short-maturity S&P 500 index futures options held to expiration for various strike prices over the period August 1987 to June 2005 (215 months). It addresses strike-to-spot ratios (moneyness) ranging from 0.94 to 1.02 in 2% increments, covering 85% of all one-month option transactions.
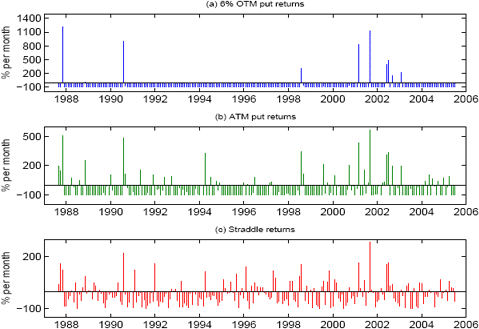
The following chart, taken from the paper, depicts the monthly returns over the entire sample period for 6% OTM put options, ATM put options and ATM straddles. It shows that most of the put option positions expire out of the money (-100% return), with intermittent equity market plunges generating occasional spikes in the return.
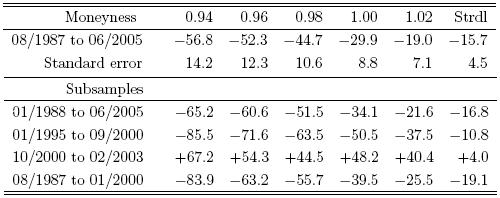
The following table, excerpted from the paper, summarizes average monthly returns and volatilities (standard errors) for the put option positions by moneyness and for the ATM straddles (Strdl). It shows that all positions generate on average large, statistically significant negative returns (for example, -30% per month for ATM put options). Selling these options therefore generates positive returns. However, the results for calendar-based subsamples show that the returns for put options are unstable over time, generating large positive returns during the 2000-2002 bear market.
In summary, a strategy of systematically selling index put options generates on average large abnormal returns but suffers occasional very large setbacks when the underlying index plunges.
Frequently Asked Questions
What is an index put option and why would an investor sell one?
An index put option gives the holder the right to sell an index such as the S&P 500 at a set strike price, and sellers collect a premium for taking on that downside risk. In the studies summarized, selling S&P 500 futures put options and straddles earned positive returns as compensation for assuming volatility and jump risks, because buyers of these options lost money on average.
Does selling S&P 500 put options generate abnormal returns?
Selling S&P 500 index put options has generated large average abnormal returns, but with occasional very large losses when the index plunges. Buyers of out-of-the-money puts lost a mean of 41% per month and buyers of at-the-money straddles lost 13% per month (January 1987 to June 2001), so sellers gained. Held-to-expiration at-the-money puts averaged about -30% per month for buyers from August 1987 to June 2005, and the results were statistically significant.
How are index option returns measured in studies of selling puts?
Studies measure monthly returns on short-maturity S&P 500 futures options across different strike-to-spot ratios (moneyness). One study used daily Chicago Mercantile Exchange data from January 1987 to June 2001 and traded at the turn of calendar months without holding to maturity, using 96% strike-to-spot out-of-the-money puts and at-the-money straddles. The other held options to expiration over 215 months (August 1987 to June 2005), covering moneyness from 0.94 to 1.02 in 2% increments, or 85% of all one-month option transactions.
How do put option selling returns compare with simply holding the S&P 500 in terms of risk-adjusted performance?
Short put and straddle positions on the S&P 500 produced higher Sharpe ratios than the underlying index futures, even though their volatility was much higher. The S&P 500 futures averaged +1.3% per month, while buying puts averaged -41% and buying straddles -13%, so selling them was rewarded. The authors conclude the positions are statistically and economically significant and robust to transaction costs and margin requirements, making short positions attractive to most asset-allocating investors.
What are the risks of a strategy that systematically sells index put options?
Systematically selling index put options suffers occasional very large losses when the underlying index plunges. Most put options expire out of the money (a -100% return for the buyer), but intermittent market plunges produce sharp spikes in returns, so seller profits are unstable over time. For example, put option returns were large and positive for buyers during the 2000-2002 bear market, which would have meant heavy losses for sellers.