Do implications of equity option prices predict returns for underlying stocks? In their December 2013 paper entitled “Option-Implied Volatility Measures and Stock Return Predictability” Xi Fu, Eser Arisoy, Mark Shackleton and Mehmet Umutlu compare the abilities of various option-implied volatility metrics to predict returns for individual stocks at horizons of one to three months. Specifically, they consider:
- Call-Put Implied Volatility spread (CPIV): difference between at-the-money call and at-the-money put implied volatilities.
- Implied Volatility Skew (IVSKEW): difference between out-of-the-money put and at-the-money call implied volatilities.
- Above-Minus-Below (AMB): difference between average of in-the-money put and out-of-the-money call implied volatilities and average of in-the-money call and out-of-the-money put implied volatilities.
- Call Out-Minus-At (COMA): difference between out-of-the-money call and at-the-money call implied volatilities.
- Put Out-Minus-At (POMA): difference between out-of-the-money put and at-the-money put implied volatilities.
- Realized Volatility-Implied Volatility spread RVIV): difference between realized volatility (annualized standard deviation of daily returns over the previous month) and implied volatility.
Each month, they rank stocks into quintiles based on each of these six metrics. They then form respective capitalization-weighted and equal-weighted hedge portfolios that are long (short) the quintiles with the highest (lowest) values of each metric and hold for one month. They also perform regressions to control portfolio returns over one, two and three months for a variety of market, stock and option characteristics. Using firm financial statement data, monthly and daily stock returns and monthly option-implied volatilities (from options with maturities of one to three months) during February 1996 through December 2011 (191 months), they find that:
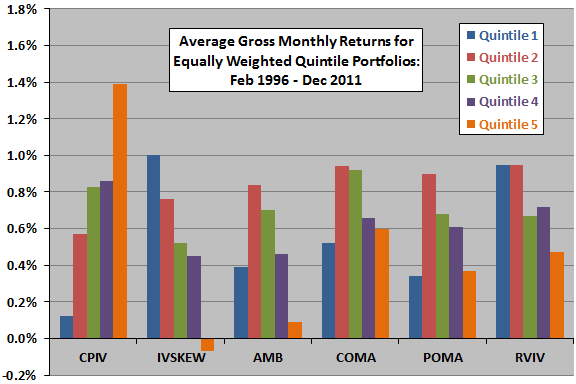
- Returns for quintile and hedge portfolios reformed monthly and held for one month exhibit systematic progressions and are statistically significant for CPIV, IVSKEW and RVIV (see the chart below). For example, equally weighted hedge portfolios generate average gross monthly returns of:
- 1.27% for CPIV (high minus low).
- 1.07% for IVSKEW (low minus high).
- 0.48% for RVIV (low minus high).
- Cross-sectional regressions confirm that CPIV is the strongest predictor of next-month stock returns.
- CPIV persists as a significant predictor of stock returns at horizons of two and three months.
- COMA becomes an important predictor of two-month stock returns. For three-month returns, COMA is the strongest predictor.
The following chart, constructed from data in the paper, summarizes average gross monthly returns for equally weighted quintiles (ranked fifths) of stocks sorted monthly on each of the above six implied volatility metrics and held for one month. For each metric, quintile 1 (5) consists of stocks with the lowest (highest) values. Progressions of returns across quintiles are most systematic for CPIV, IVSKEW and RVIV. Hedge portfolio returns are strongest for CPIV (high minus low) and IVSKEW (low minus high). Short sides of hedge portfolios generally do not augment gross returns over the selected sample period.
In summary, evidence suggests that investors may be able to exploit CPIV and IVSKEW as stock return predictors at a one-month horizon and COMA at longer horizons.
Cautions regarding findings include:
- Reported returns are gross, not net. Including trading frictions and cost of data would lower quintile returns. Including shorting costs would further lower hedge portfolio returns. Shorting may not be feasible for some stocks. Frictions/costs may vary systematically by quintile, such that net findings would differ from gross findings.
- It appears that quintile formation and trade execution coincide. Given the complexity of calculations, this instant execution is problematic.
- Selection of parameters (such as moneyness criteria) within implied volatility metrics may introduce data snooping bias, as do use of multiple metrics and consideration of different portfolio holding intervals. Best results therefore probably overstate expected performance.
- Regressions assume linear relationships between indicator values and futures stock returns. As suggested by the chart above, relationships may not be linear.
- Many investors may not be able to hold enough individual stocks to assure outcome reliability.