Do returns for covered calls on individual stocks vary systematically with stock volatility and liquidity? In the January 2010 version of their paper entitled “Option Returns and Individual Stock Volatility”, Jie Cao and Bing Han compare monthly returns of portfolios of short-term (formed about 1.5 months from expiration and held one month), at-the-money covered call options sorted by either total volatility (standard deviation of daily stock returns over the previous month) or idiosyncratic (market-independent) volatility of the underlying stocks. They also examine a double sort by market capitalization and total volatility. Using daily stock and option price data for a broad sample of U.S. equities over the period January 1996 through December 2006, they conclude that:
- Assuming execution at the bid-ask midpoint, a hedge portfolio that is long (short) covered calls on the 20% of stocks with the highest (lowest) total volatilities, rebalanced monthly with equal weighting, generates an average monthly return of 2.33%. Common risk factors (such as market risk, size effect and value premium) do not explain this spread.
- Results based on idiosyncratic rather than total stock volatilities are very similar.
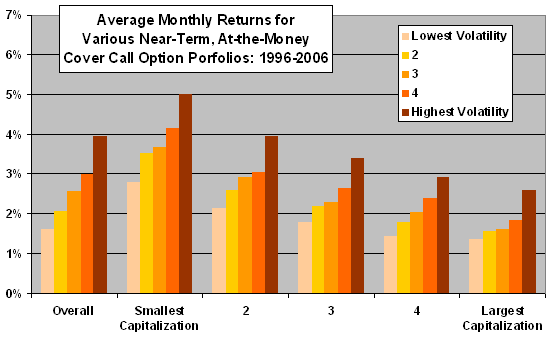
- This volatility risk premium exists for five of five market capitalization segments (see chart below) and three of three subperiods.
- However, imposing round-trip trading friction equal to 100% of the quoted bid-ask spread reduces the average monthly hedge return from 2.33% to a statistically insignificant 0.22%. Hence, only market participants who operate with low trading friction can exploit the effect.
- Results suggest that equity options embed a negative premium that increases with volatility of the underlying stock. This premium could represent compensation to option sellers who are unable to hedge associated risk, a preference of option buyers for positive skewness in expected returns or overestimation by option buyers of volatility risk.
The following chart, constructed from data in the paper, shows the variation in average monthly returns of equally weighted portfolios of short-term, at-the-money covered calls, reformed monthly over the period 1996-2006. The left-most set of returns is for the entire sample sorted by total volatility. The other five sets are for a double sort by market capitalization and total volatility. Results optimistically assume execution of option transactions at the bid-ask midpoint, with no transaction fees. These largely frictionless results suggest a volatility risk premium that increases with volatility and decreases with market capitalization.

In summary, evidence from pricing of call options on individual stocks supports belief in a volatility risk premium that increases with stock volatility and decreases with firm market capitalization, but only investors who keep trading frictions low can exploit the variations in premium.