Does trading in stock index options exploitably predict the behavior of the stock market? In their June 2016 paper entitled “The Informational Role of Index Option Trading”, Tarun Chordia, Alexander Kurov and Avanidhar Subrahmanyam examine the relationship between U.S. equity index option net order imbalance and future S&P 500 Index returns. They calculate net order imbalance as the weekly difference between position-opening buy and position-opening sell contract volumes, divided by the total weekly position-opening volume. They calculate this net order imbalance separately for calls and puts across four equity indexes: ISE 250 Index, Russell 2000 Index, Nasdaq 100 Index and S&P MidCap 400 Index. For robustness tests, they compute analogous net order imbalances for E-mini S&P 500 futures contracts, individual NYSE stocks and SPDR S&P 500 (SPY). They also investigate interactions of equity index option net order imbalance with the S&P 500 Implied Volatility Index (VIX) and detrended weekly average values of the short-term interest rate (3-month U.S. Treasury bill yield), the term spread (difference between 10-year and 3-month U.S. Treasury yields) and the credit spread (difference between the Moody’s BAA and AAA yields). Using daily records of equity index option buys and sells (including whether each trade opens or closes a position) and other specified data during January 2006 through December 2013, they find that:
- For index options trading:
- Two thirds of volume is at-the-money (strike within 10% of index level), one third is out-of-the-money and only 1% is in-the-money.
- Volume-weighted average maturity is about one month for both puts and calls.
- Put options have higher volumes and lower spreads than call options.
- Average net order imbalances are -0.8% for puts and -2.6% for calls.
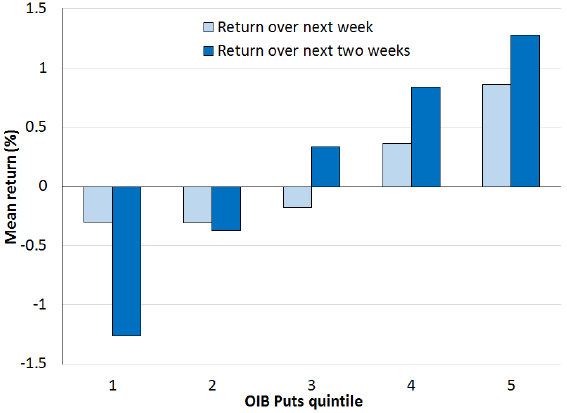
- Net order imbalance in index puts relates positively to near-term index returns (see the chart below), with no subsequent reversal. Overall, a one standard deviation increase in net order imbalance for puts predicts a 0.3% increase in next-week S&P 500 Index return. This predictive power is:
- Stronger when VIX is high.
- Statistically significant only during weeks containing announcements of U.S. Consumer Price Index, Gross Domestic Product and unemployment.
- Stronger when puts are more liquid (lower spreads).
- Net order imbalance in index puts also relates negatively to near-term VIX, positively to near-term U.S. Treasury bill yield and negatively to near-term credit spread.
- Call option net order imbalance does not predict stock index returns or economic variables.
- Findings persist after controlling for order imbalance for E-mini futures, order imbalance for SPY, S&P 500 Index past returns and economic variables.
- Results suggest that market makers (who are large institutional traders) effectively predict equity market reactions to major economic announcements and lower spreads to attract wrong-sided counterparties before these announcements.
The following chart, taken from the paper, summarizes average S&P 500 Index returns over the next one and two weeks by ranked fifth (quintile) of equity index put option net order imbalance over the sample period. Average return increases consistently from the lowest quintile to the highest. In other words, when index option traders are most optimistic (pessimistic) by opening short (long) index put positions, near-term S&P 500 Index returns are weakest (strongest).
In summary, evidence indicates that net order imbalance of U.S. equity index put options is a contrarian indicator of near-term U.S. stock market returns, most significantly during weeks of major economic announcements when VIX is elevated.
Cautions regarding findings include:
- Quantification of the predictive power of equity index put option net order imbalance is in-sample. There are no tests of realistic strategies seeking to exploit the in-sample findings.
- Input data are not readily available to most traders (but are available to large institutional market makers).
- The sample period is not long in terms of variety of market conditions (such as VIX regimes). The very unusual market crash and rebound of 2008-2009 may strongly influence findings.