
Does a simple strategy of iteratively selling covered calls (buy-write) on the Russell 2000 Index beat buying and holding the index? In their September 2011 paper entitled “15 Years of the Russell 2000 Buy‐Write”, Nikunj Kapadia and Edward Szado evaluate returns on ten alternative buy‐write strategies for the Russell 2000 Index. Specifically, they consider one-month and two-month maturities and five levels of approximate moneyness: at-the-money (ATM); 2% and 5% in-the-money (ITM); and, 2% and 5% out-of-the-money (OTM). They estimate spread trading friction based on selling at the bid or at the bid-ask midpoint. They hold to expiration and cash settle at approximate expiration intrinsic value. Using monthly Russell 2000 Index total returns and Russell 2000 Index option bid-ask and implied volatility data from January 1996 through March 2011 (182 months), they find that:
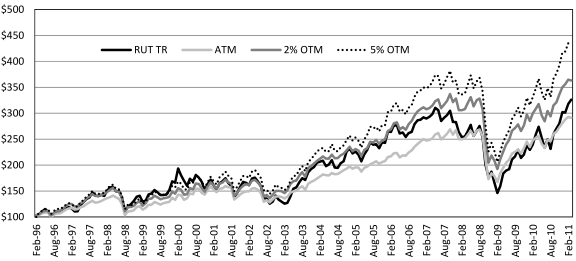
- Over the the entire sample period (see the first chart below), a baseline Russell 2000 Index buy‐write strategy implemented via 2% OTM options with one month to expiration generates a higher annualized return than the index (8.9% versus 8.1%) with lower standard deviation of annual returns (16.6% versus 21.1%). However, selling options with two months to expiration does not consistently beat the index.
- While buy‐write strategy returns are significantly more fat‐tailed and negatively skewed than index returns, various measures of risk other than standard deviation confirm buy-write attractiveness.
- Subperiod performances for 2% OTM options with one month to expiration are:
- During the favorable February 1996 through February 2003 subperiod, the buy‐write strategy outperforms the index based on annualized return (5.5% versus 3.3%) with lower annual volatility (16.8% versus 21.8%).
- During the unfavorable March 2003 through October 2007 subperiod, the buy‐write strategy slightly underperforms the index based on annualized return (19.6% versus 20.9%) with lower annual volatility (10.5% versus 14.1%).
- During the November 2007 through March 2011 (crisis) subperiod, the buy‐write strategy slightly outperforms the index based on annualized return (2.2% versus 2.0%) with lower annual volatility (22.1% versus 26.8%).
- On average, the volatility risk premium (derived from the difference between implied volatility and realized volatility of the index) drives the outperformance of OTM buy-write strategies, more than offsetting intrinsic value losses and trading frictions.
The following chart, taken from the paper, tracks over the entire sample period values of $100 initial investments in the Russell 2000 Index (total return) and three buy-write strategies implemented by iteratively selling ATM, 2% OTM and 5% OTM covered call options with one month to maturity at the bid and holding to expiration. Sharpe ratios are 0.27, 0.33 and 0.37 for the ATM, 2% OTM and 5% OTM strategies, respectively, compared to 0.23 for the underlying index.
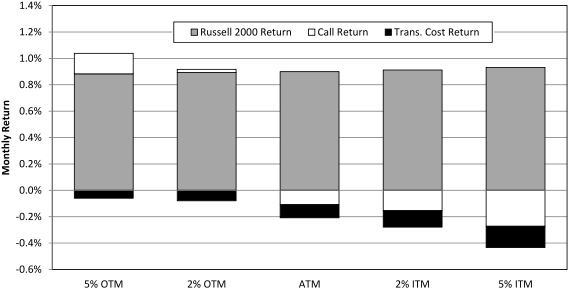
The next chart, also from the paper, summarizes the components of buy-write strategy average monthly return as implemented by selling covered call options with one month to expiration for five levels of moneyness. Russell 2000 Index performance dominates buy-write strategy returns, averaging nearly 1% per month. ATM and ITM strategies realize an average gross monthly loss (based on selling call options at the bid-ask midpoint). Transaction costs (calculated as the difference in returns from selling at the bid rather than the bid-ask midpoint) are a material drag on performance at all levels of moneyness.
In summary, evidence indicates that Russell 2000 Index buy-write strategies generally outperform buying and holding the index on a (partially net) risk-adjusted based, and sometimes on a raw basis for OTM options with one month to expiration.
Cautions regarding findings include:
- As noted in the paper: (1) the moneyness of call options sold deviates somewhat from target levels based on actual option prices; and, (2) cash settlement prices based on expiration day index closes deviate somewhat from true settlement prices based on next-day opens.
- Testing ten maturity and moneyness alternatives introduces some data snooping bias, such that the best-performing alternative may overstate reasonable out-of-sample expectations.
- Trading frictions do not include broker fees for selling and settling the options written. These fees would reduce reported buy-write performance.
- The study assumes perfect call coverage of index holdings. It does not address monthly augmentation or liquidation of index holdings based on option performance, or mismatches between index holdings and call option coverage. The trading frictions and residual cash associated with these imperfections may dent buy-write performance.
- Investors cannot directly buy and hold the Russell 2000 Index. Substituting a tradable asset, such as iShares Russell 2000 Index (IWM), may affect results.
- The study does not account for any taxes on option income for the buy-write strategy.
Frequently Asked Questions
What is a buy-write strategy in investing?
A buy-write strategy involves holding an asset, such as an index, while iteratively selling covered call options against that holding. In the Russell 2000 study, the strategy sold one-month calls (for example, 2% out-of-the-money) and held them to expiration with cash settlement. The investor collects option premium in exchange for giving up gains above the strike price.
Does a Russell 2000 buy-write strategy beat buying and holding the index?
A Russell 2000 buy-write strategy using 2% out-of-the-money calls with one month to expiration beat the index from January 1996 through March 2011, returning 8.9% versus 8.1% annualized with lower volatility (16.6% versus 21.1%). Outperformance was not consistent across subperiods, and selling options with two months to expiration did not consistently beat the index. Evidence is stronger on a risk-adjusted basis, with Sharpe ratios of 0.27 to 0.37 versus 0.23 for the index.
How is the performance of a Russell 2000 covered call strategy tested?
The Russell 2000 buy-write strategy was tested using monthly index total returns and option bid-ask and implied volatility data from January 1996 through March 2011 (182 months). Ten variations were evaluated, combining one- and two-month maturities with five moneyness levels (ATM, 2% and 5% ITM, 2% and 5% OTM). Calls were sold at the bid or bid-ask midpoint, held to expiration, and cash settled at approximate intrinsic value.
Why do out-of-the-money buy-write strategies outperform at-the-money or in-the-money covered calls?
Out-of-the-money buy-write strategies on the Russell 2000 outperformed mainly because the volatility risk premium (implied volatility exceeding realized volatility) more than offset intrinsic value losses and trading frictions. At-the-money and in-the-money strategies realized average gross monthly losses when calls were sold at the bid-ask midpoint. Sharpe ratios rose with out-of-the-money distance: 0.27 for ATM, 0.33 for 2% OTM, and 0.37 for 5% OTM.
What are the limitations and risks of a Russell 2000 buy-write backtest?
The Russell 2000 buy-write results may be overstated because testing ten alternatives introduces data snooping bias, and the best-performing variant may not hold out of sample. The backtest excludes broker fees and taxes, assumes perfect call coverage of index holdings, and uses the untradable index rather than a fund like IWM. Buy-write returns are also more fat-tailed and negatively skewed than index returns, and moneyness and settlement prices deviate somewhat from targets.