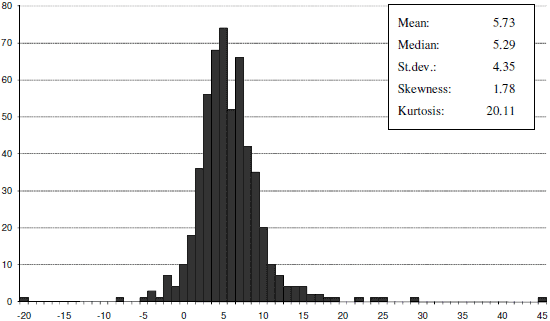
What would the distribution of equity risk premium estimates from a broad sample of studies look like? What factors explain the dispersion of estimates? In their August 2010 paper entitled “A Meta-Analysis of the Equity Premium”, Casper van Ewijk, Henri L.F. de Groota and Coos Santing collect and analyze equity risk premium estimates derived from a broad range of sample periods, markets and methods. Using a base of 24 studies including 535 distinct measurements of the equity risk premium, they find that:
- The estimated equity risk premium depends on when researchers collect measurements. In general, estimates were low until 1920, high in the 1920s and high again post-World War II (with a dip in the 1970s).
- The estimated equity risk premium depends on where researchers collect measurements, with estimates relatively low (high) in developed (emerging) markets. Average estimates vary from a low for Canada (3.95%) to a high for the Asian Tigers (13.1%).
- The estimated equity risk premium depends on how researchers collect and process measurements. The average of arithmetic (geometric) mean estimates is 6.37% (4.46%). The average of ex post (ex ante) estimates is 6.03% (4.48%). The average of estimates based on Treasury bills (bonds) as the risk-free rate is 6.07% (5.26%).
- Estimates of the equity risk premium tend to be higher for sample periods and countries with higher economic volatility. A one standard deviation increase in the volatility of Gross Domestic Product indicates a 1.7% increase in estimated equity risk premium.
- Nominal interest rates relate negatively to the estimated equity risk premium. A 1% increase in interest rates indicates a 0.5% decrease in the estimate.
The following chart, taken from the paper, shows the distribution of equity risk premium estimates for all 535 observations, along with some distribution statistics (the distribution is not normal). The average of all estimates is 5.73%. Out of the 535 estimates, 24 (48) of are negative (greater than 10%).

In summary, estimates of the reward for risking equity investment vary with sample period, market and calculation method. Estimates tend to be higher when GDP is volatile and nominal interest rates are low.