Is there an exploitable way to predict when short-term stock market return will be negative? In his June 2018 paper entitled “Predictable Downturns”, Carter Davis tests a random forest regression-based forecasting model to predict next-day U.S. stock market downturns. He uses the value-weighted return of a portfolio of the 10 U.S. stocks with the largest market capitalizations at the end of the prior year minus the U.S. Treasury bill (T-bill) yield as a proxy for excess market return. He employs a two-step test process:
- Use a rolling 10-year historical window of 143 input variables (economic, equity factor, market volatility, stock trading, calendar) to find when the probability of negative portfolio daily excess return is at least 55%.
- Calculate whether the average portfolio gross excess return of all such days is in fact significantly less than zero.
He corrects for data snooping bias associated with the modeling approach. He further investigates which input variables are most important and tests a market timing strategy that holds the 10-stock portfolio (T-bills) when predicted portfolio return is negative (non-negative) as specified above. Using data for the input variables and returns for test portfolio stocks during July 1926 through July 2017, he finds that:
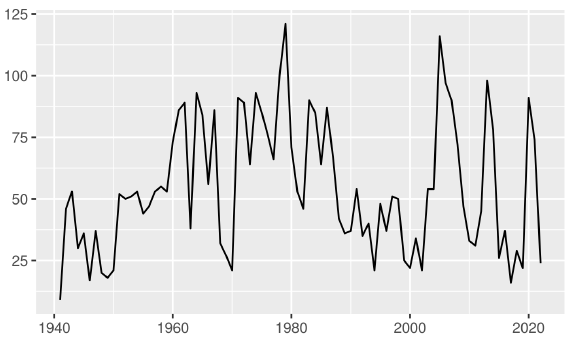
- The model predicts negative portfolio returns for 21.2% of trading days (see the chart below), ranging from about 1% to nearly 50% during a given calendar year.
- Average 10-stock portfolio gross excess return on these days is -0.139% with standard error 0.015%.
- Both overnight and intraday average excess returns are negative, with the latter more negative than the former.
- Since the beginning of of 1980 average daily gross excess return is -0.105%.
- Result are robust to changing the number of stocks in the test portfolio.
- Model predictive power fades steadily over horizons longer than one day and fails at horizons over two weeks.
- Volatility indexes are the most important input variables. The precious metals stock index and the oil/natural gas stock index are also important, as are the market, short-term reversal, profitability and size equity factors. Other variables contribute little or even detract from predictive power.
- The specified market timing strategy generates gross daily market (1-factor) alpha 0.035% (8.8% annualized), with market beta 0.73.
The following chart, taken from the paper, summarizes the number of trading days with negative predicted 10-stock portfolio excess return over the sample period. The percentage of such days ranges from 1% to nearly 50%.

In summary, evidence indicates that it is possible to predict when daily gross excess return of the stock market will be negative using a sophisticated regression model.
Cautions regarding findings include:
- Results are gross, not net. There may be many trades, and associated frictions may eliminate test strategy profitability. The author does not report strategy turnover.
- The specified modeling approach is beyond the reach of most investors, who would bear fees for delegating the effort to a fund manager. The study indicates that a simpler approach, at least in terms of number of inputs, may be useful.