How (and what) does John Bogle think about the stock and bond markets over the next decade? In their October 2015 article entitled “Occam’s Razor Redux: Establishing Reasonable Expectations for Financial Market Returns”, flagged by a subscriber, John Bogle and Michael Nolan revisit simple models for expected stock market and government bond returns first published in 1991. The stock market model distinguishes between: (1) investment return, defined as initial dividend yield plus expected annual earnings growth rate; and, (2) speculative return, defined as annual percentage change in price-to-earnings ratio (P/E). The government bond model uses the initial interest rate as a reasonable expectation for return over the life of the bond. In both models, the investment horizon is a decade. They update performances of the models to include the 25 years since publication and apply them to determine expectations for stock and bond market returns over the decade ahead. Using data for the stock market since 1871 and for 10-year U.S. Treasury notes (or equivalent) since 1915, both through 2014, they find that:
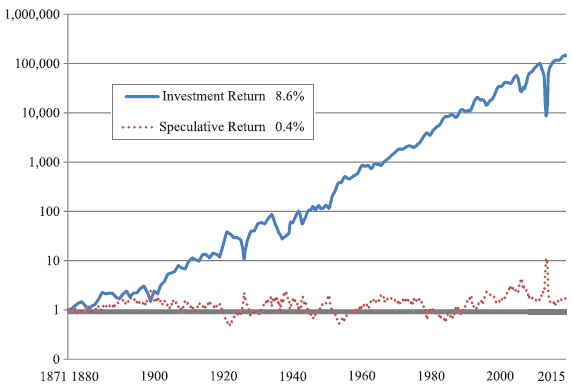
- During 1871-2014, stock market annualized nominal investment return is 8.6%, compared to just 0.4% for speculative return (see the chart below), indicating that intrinsic business value drives long-run equity return.
- During 1990-2014, the correlation between predicted and actual nominal stock market annualized returns based on monthly rolling 10-year intervals is 0.81 and the R-squared statistic is 0.65, indicating that the model explains 65% of future return market behavior. During 1915-2014, the correlation is 0.67 and R-squared 0.44.
- During 1915-2014, the correlation between 10-year future annualized return on 10-year U.S. Treasury notes and initial yield based on one-year rolling intervals is 0.95 and R-squared is 0.90.
- For the U.S. stock market as of the beginning of 2015:
- Dividend yield is 2.1% and expected annual earnings growth rate is about 5%, indicating a nominal annualized investment return of 7% over the next decade.
- Stock market P/E is around 20. Reversion to the long-run mean P/E of 17.8 would produce an annualized nominal speculative return of about -1% over the next decade.
- Overall expected annualized stock market return over the next decade is therefore about 6%.
- Yield to maturity for U.S. Treasury notes as of mid-2015 is 2.4%, suggesting an annualized return in the range 2% to 3% over the coming decade.
- A portfolio of 50% U.S. stocks and 50% U.S. Treasury notes therefore has an expected annualized return of about 4% to 4.5%.
- Accounting for fund costs and adjusting for taxes materially reduces this return.
- Adjusting for an inflation rate of 1.5% to 3% could make real annualized return negative.
The following chart, taken from the article, compares cumulative investment return (based on annual initial dividend yield plus earnings growth) and cumulative speculative return (based on annual change in P/E) for the U.S. stock market during 1871 through 2014. Results indicate that the former drives overall stock market performance, while the latter is noise.
In summary, John Bogle’s simple models of stock market returns and government bond returns indicate a poor return over the next decade for a portfolio of U.S. stocks and U.S. Treasuries.
Cautions regarding findings include:
- Using overlapping 10-year measurement intervals (at a monthly frequency for the stock market and an annual frequency for bonds) introduces strong autocorrelations within the series being compared. This approach exaggerates sample sizes and can strongly overstate strengths of relationships based on linear regressions. In other words, a 25-year sample is extremely small (and even a 100-year sample is small) in terms of independent 10-year measurement intervals. The correlations and R-squared statistics reported are likely much overstated.
- Statistical methods also assume that return distributions are tame (normal). To the extent that market return distributions are not tame (for example, are instead fat-tailed), these methods lose predictive power.
- Modelers may choose to revisit old models at points in time when the models appear to be performing well, and to ignore them when they are not.