How might the capital gains tax rate affect stock market returns? First, a relatively low (high) rate might encourage (discourage) capital investment and stimulate (depress) economic growth, thereby persistently increasing (decreasing) corporate earnings and stock market returns. Second, an increase (decrease) in the rate might immediately drive lower (higher) portfolio allocations to stocks and thereby cause a temporary dip (spike) in stock market returns. To investigate, we relate the annual maximum capital gains tax rate in the U.S. to annual S&P 500 Index returns (capital gains only). When there there is a change in the tax rate during a year, we use the changed value. Using annual data for 1954 through 2012 (partial), we find that:
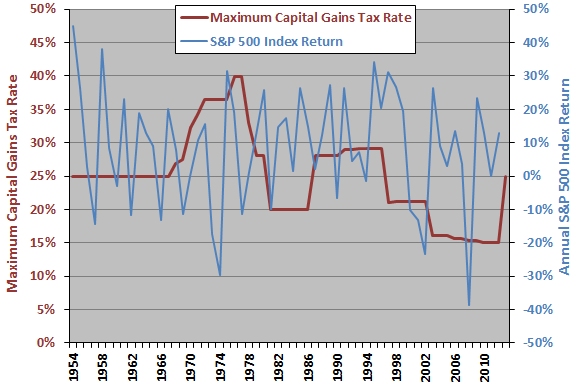
The following chart shows the maximum capital gains tax rate in the U.S. and S&P 500 Index return by year over the sample period. The tax rate for 2013 is estimated. It is difficult to make inferences about the relationship based on this view.
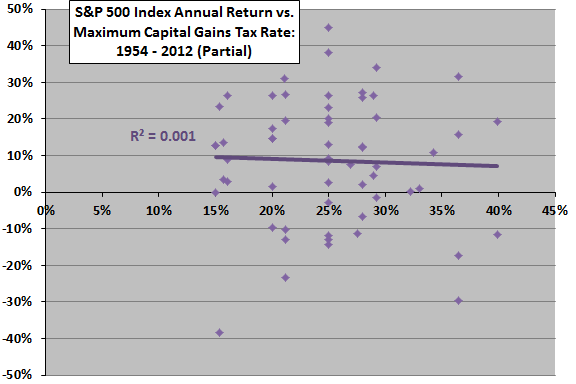
For greater precision, we use a scatter plot to relate stock market return to capital gains tax rate.

The following scatter plot relates S&P 500 Index annual return to same-year maximum capital gains tax rate over the sample period. The R-squared statistic for the relationship is practically zero, indicating no relationship between the two series.
What about the effect of changes in the capital gains tax rate?

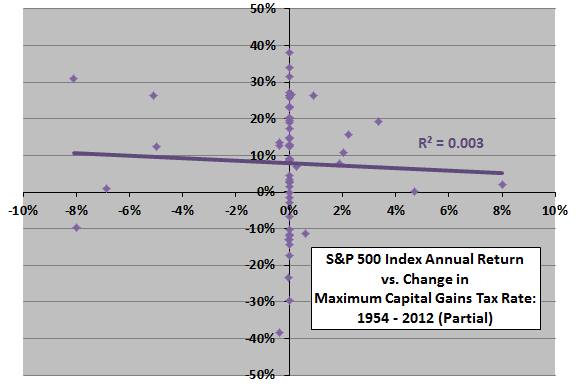
The next scatter plot relates S&P 500 Index annual return to same-year change in maximum capital gains tax rate over the sample period. The R-squared statistic for this relationship is also practically zero, indicating no relationship.
The very small number of tax rate changes during the sample period makes inference difficult.
Might there be a leading or lagging relationship between these two series?

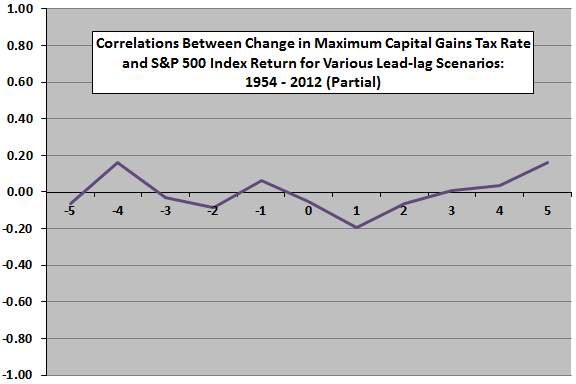
The final chart summarizes correlations between change in maximum capital gains tax rate and S&P 500 Index annual return over the sample period, ranging from stock market return leads tax rate change by five years (-5) to tax rate change leads stock market return by five years (5).
Given the small number of tax rate changes in the sample, the correlations are all small and probably noise.

In summary, evidence from simple tests does not support belief in connections between the maximum U.S. capital gains tax rate and U.S. stock market returns.
Cautions regarding findings include:
- As noted, there are few changes in the capital gains tax rate during the sample period, making inference about changes difficult.
- The top rate does not hit all investors in all years.
- Political impetus to change the capital gains tax rate may relate to economic conditions (and therefore corporate earnings), thereby confounding the relationship between tax rate and stock market returns.
- The introduction and growth of tax-deferred retirement accounts during the sample period tends to disconnect investments and taxes.