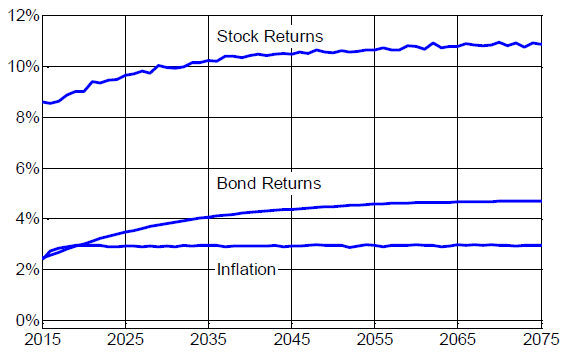
Do variable retirement spending strategies offer greater utility than fixed-amount or fixed-percentage strategies? In his March 2015 paper entitled “Making Sense Out of Variable Spending Strategies for Retirees”, Wade Pfau compares via simulation ten retirement spending strategies based on a common set of assumptions. He classifies these strategies into two categories: (1) those based on decision rules (such as fixed real spending and fixed percentage spending); and, (2) actuarial models based on remaining portfolio balance and estimated remaining longevity. His bases comparisons on 10,000 Monte Carlo runs for each strategy. He assumes a retirement portfolio of 50% U.S. stocks and 50% U.S. government bonds with initial value $100,000, rebalanced annually after end-of-year 0.5% fees and beginning-of-year withdrawals. He calibrates initial spending where feasible by imposing a probability of X% (X=10) that real spending falls below $Y (Y=1,500) by year Z of retirement (Z=30). He treats terminal wealth as unintentional (in fact, undesirable), with the essential trade-off between spending more now and having to cut spending later. He ignores tax implications. Using historical return data from Robert Shiller and current levels of inflation and interest rates (see the chart below), he finds that:
- For rule-based methods:
- A baseline strategy of constant real spending supports an initial spending rate of 2.85%. For the the median outcome, almost 80% of initial real wealth remains after 30 years. At the 90th percentile of outcomes, real wealth grows by almost 2.7 times after 30 years.
- Spending with growth less than the inflation rate increases the initial spending rate to 3.26%, but real spending then gradually declines. Terminal wealth after 30 years may be high except for the worst scenarios because there are no upward adjustments after good portfolio returns.
- Spending a fixed percentage of the remaining portfolio is not amenable to calibration via XYZ assumptions and is therefore difficult to compare.
- Spending that fluctuates with portfolio returns between a floor and a ceiling supports an initial spending rate of 3.29%. This strategy is generally a little more efficient than the baseline in consuming wealth, but terminal wealth can still more than double with good market returns.
- Spending that increases faster than inflation when portfolio value rises but decreases when the portfolio value falls supports an initial spending rate of 4.95%. This strategy is more efficient than the baseline in consuming wealth, with relatively low terminal wealth.
- Following a critical path for how much wealth should remain after each year of retirement based on assumptions of fixed returns and a 45-year horizon supports an initial spending rate of 3.42%. This strategy also consumes wealth more efficiently than the baseline, but does not allow spending to increase above the initial level when markets are doing well.
- For actuarial methods (which all consume wealth more efficiently than the baseline):
- Conventional required minimum distributions based on IRS rules, which imply spending an increasing percentage of remaining assets (3.23% at age 65, 3.65% at 70, etc.) supports growing real spending for median and 90th percentile outcomes, but declining real spending for the 10th percentile outcome.
- A required minimum distribution strategy modified to match XYZ assumptions supports an initial spending level of 4.01%.
- An annuity payment formula is relatively aggressive in that it updates life expectancy annually and uses nominal rather than real interest rates, generally supporting relatively high initial spending (4.34%) that declines throughout retirement. Median outcome spending is roughly steady at least through the first 10 years of retirement.
- A hybrid approach that applies actuarial strategy #3 to 40% of wealth at retirement and rules-based strategy #4 to 60% of wealth at retirement supports a relatively high initial spending level of 4.57%, but allows spending from the rules-based portion to fall aggressively when market returns are low.
- An individual who can cover basic spending requirements with Social Security and other pensions can treat portfolio withdrawals as discretionary and therefore take greater risks.
The following chart, taken from the paper, summarizes estimated median stock return, bond return and inflation rate for the 30-year simulations compared in the study.

In summary, there are many moving parts to models of spending potential throughout retirement, such that no single metric is sufficient to compare them and individual goals/preferences are critical to model selection.
Overall, results suggest that an initial withdrawal rate of about 3% (5%) of portfolio value is conservative (aggressive).
Cautions regarding findings include:
- Assumptions about asset return distribution statistics used in simulations may be materially inaccurate.
- Spending may have greater utility early in retirement than late because of declining capability to enjoy consumption. Also, leaving a legacy to heirs or charities may provide utility ignored in simulations.
- Tax regulations may change during retirement.