Does optimal asset allocation, as measured by Sharpe ratio, depend on investment horizon? In their January 2015 paper entitled “Optimal Asset Allocation Across Investment Horizons”, Ronald Best, Charles Hodges and James Yoder explore the optimal (highest Sharpe ratio) mix of long-term U.S. corporate bonds and large-capitalization U.S. common stocks across investment horizons from one to 25 years. They test portfolios ranging from 100%-0% to 0%-100% stocks-bonds in 5% increments with annual rebalancing. They estimate annual returns for stocks and bonds based on 87 years of historical data. They simulate the portfolio return distribution for a given n-year holding period via 2,500 iterations for each of two methods:
- Randomly select with replacement n years from the 87 years in the historical sample and use the annual returns for U.S. Treasury bills (T-bills, the risk-free rate), stocks and bonds for those n years in the order selected to calculate portfolio gross compound n-year excess returns. This method assumes year-to-year independence (zero autocorrelations) of annual returns for stocks and bonds, meaning no momentum or reversion.
- Randomly select a year from the first 87 – (n-1) years in the historical sample and use the annual returns for T-bills, stocks and bonds for that and the next n-1 consecutive years to calculate portfolio gross compound n-year excess returns. This method preserves historical autocorrelations in return series.
Using annual returns for T-bills, U.S. large-capitalization common stocks and U.S. long-term corporate bonds during 1926 through 2012, they find that:
- In the historical sample, the average annual (25-year compounded) return for:
- T-bills is 3.62% (146%).
- 100% bonds is 6.09% (351%).
- 50%-50% stocks-bonds is 8.92% (924%).
- 100% stocks is 11.8% (1,496%).
- If annual returns are independent from year to year, the optimal weight of bonds increases with investment horizon (from 60% for a one-year investment horizon to 95% for a 25-year investment horizon).
- If asset annual return time series exhibit historical non-zero autocorrelations (see the chart below), the optimal weight of stocks increases with investment horizon (from 40% for a one-year investment horizon to 85% for a 25-year investment horizon).
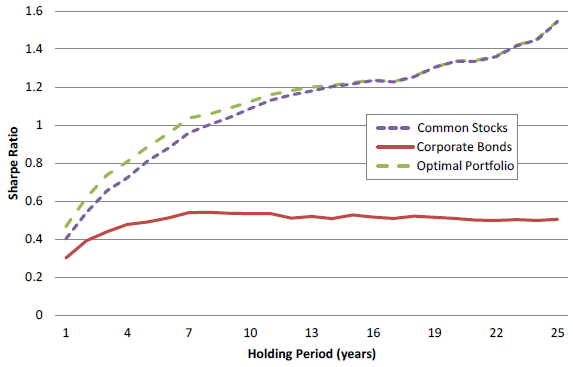
The following chart, taken from the paper, shows how gross Sharpe ratio varies with investment horizon for three portfolio simulations that retain autocorrelations exhibited in historical returns:
- 100% large-capitalization U.S. stocks (Common Stocks).
- 100% long-term U.S. corporate bonds (Corporate Bonds).
- Stocks-bonds mix that generates the highest Sharpe ratio (Optimal Portfolio).
Results show that the optimal mix of stocks and bonds outperforms 100% stocks and 100% bonds portfolios for investment horizons (Holding Periods) less than about 15 years. For longer holding periods there is little difference between the gross Sharpe ratios for the 100% stocks and optimal portfolios. Another perspective is that as investment horizon increases, the Sharpe ratio-optimal portfolio weight for stocks increases toward 100%.
A corollary is that, if future asset class return series autocorrelations are markedly different from past autocorrelations, then actual optimal portfolios may be very different from those derived from historical data.
In summary, evidence from simulations indicates that the Sharpe ratio-optimal mix of stocks and bonds varies with investment horizon and is sensitive to assumptions about autocorrelations of asset class return time series.
Cautions regarding findings include:
- The historical sample is very short relative to long holding periods (for example, fewer than four independent 25-year intervals).
- Results assume no frictions for formation and maintenance of liquid stock and bond funds to populate portfolios, or for annual rebalancing. These frictions would reduce reported performance and may alter findings because of varying effects on differently weighted portfolios.
- Sharpe ratio may not be the most compelling metric since it penalizes both upside and downside volatility.
See also “Stocks versus Bonds as Investment Horizon Lengthens” and “Optimal Allocation to Equities Versus Investment Horizon”.