Do widely used charts of equity and bond market performance inculcate harmfully false beliefs among investors? In his September 2017 paper entitled “Stock Market Charts You Never Saw”, Edward McQuarrie dissects some of these charts and outlines cautions to investors in interpreting them. Using very long-term data for U.S. stock and bond markets spanning hundreds of years, he concludes that:
- During 1851 to 1931, the cumulative performance of the U.S. stock market is much less sanguine than since 1931. During this 81-year period, stocks end slightly below where they begin. Two declines of over 70% occur toward the end of the period.
- Investing $10,000 near the top of the 1920s bull market, and reinvesting all dividends as received, achieves terminal wealth of about $9.3 million at the end of 2008 (about 9% compound annual growth). However:
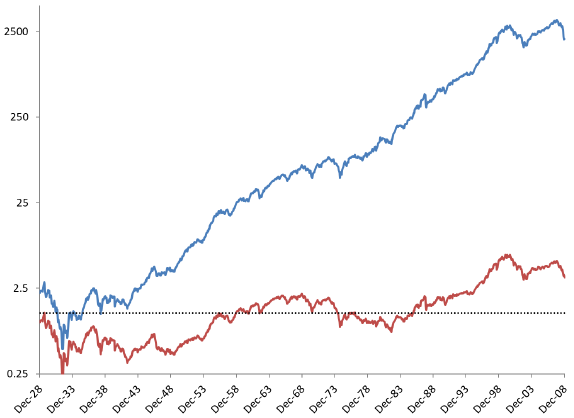
- Spending dividends as received and thinking in terms of purchasing power translates to a real final wealth of just $33,000 (about 1.5% compound growth). In other words, dividends and inflation drive 99.7% of nominal final wealth (see the chart below).
- The portfolio does not regain its pre-depression (1929) real value until mid-1955. By 1975, real value drops below its 1929 level until 1985. Nearly all real stock market growth occurs in the last 30 years. Buy-and-hold investors who spend their dividends should be prepared to endure decades of poor real returns as in 1919-1949, 1952-1982 and 1964-1994.
- In general, the best way to interpret market history may be to:
- Focus on multiple 30-year to 40-year intervals (investing lifetimes).
- Use long sample periods, including ones other than that ending at the present day.
- Include intervals most different from recent experience.
- Apply sanity tests (such as very high sustained growth leading to terminal value higher than total market capitalization).
- Applying this approach to a comparison of returns for stocks and bonds over the past 210 years indicates that:
- Sometimes, stocks outperform government bonds. At other times, government bonds outperform stocks. Much of the time, stocks and government bonds perform about the same.
- Government bonds badly underperform stocks during a few decades after 1940, accounting for much of their 210-year underperformance. Nothing like this underperformance occurs in the preceding 140 years.
- Similarly, there are several multi-decade stretches in both 19th and 20th centuries during which corporate bonds produce roughly the same final wealth as stocks, with a few decades after 1940 very bad for bonds.
- In Europe, there are multiple prolonged intervals when equities have a negative real returns, in some cases severely negative and in other cases lasting 50 years or more. The two decades after 1960 are worse in Europe than in the U.S.
The following chart, taken from the paper, compares nominal dividend-reinvested wealth growth (blue line) and real capital gains (read line) for the U.S. stock market from the 1920s peak to the end of 2008. Results show that the typical stock market chart shows strong and mostly steady gains due substantially to dividend reinvestment and inflation.

In summary, investors should consider sampling asset performance histories from long samples in investment lifetime (30-year or 40-year) intervals and not restricting samples to those with happy endings.
Cautions regarding conclusions include:
- The author’s argument generally takes the perspective that asset prices follow a random walk. He does not explore the feasibility or effectiveness of market timing.
- One might argue that recent regulatory rules, economic environment and technological environment are more relevant to market performance over the next few decades than are conditions from a century or more ago.
See also “Stock Market Performance Perspectives” and “T-bills Beat Most Stocks?”.