What is a safe portfolio withdrawal rate for early retirees who expect more than 30 years of retirement? In their February 2017 paper entitled “Safe Withdrawal Rates: A Guide for Early Retirees”, ERN tests effects of several variables on retirement portfolio success:
- Retirement horizons of 30, 40, 50 and 60 years.
- Annual inflation-adjusted withdrawal rates of 3% to 5% in increments of 0.25%.
- Terminal values of 0% to 100% of initial portfolio value in increments of 25%.
- Implications of different starting levels of Shiller’s Cyclically Adjusted Price-to-Earnings ratio (CAPE or P/E10).
- Implications of Social Security payments coming into play after retirement.
- Effects of reducing withdrawal rate over time (planning a gradual decline in consumption during retirement).
They assume 6.6% average real annual return for U.S. stocks with zero volatility. For 10-year U.S. Treasury notes (T-note), they assume 0% real return for the first 10 years and 2.6% thereafter (zero volatility except for one jump). They assume monthly withdrawal of one-twelfth the annual rate at the prior-month market close, with monthly portfolio rebalancing to target stocks and T-note allocations. They assume annual portfolio costs of 0.05% for low-cost mutual fund fees. Based on the stated assumptions, they find that:
- For success defined as not exhausting funds:
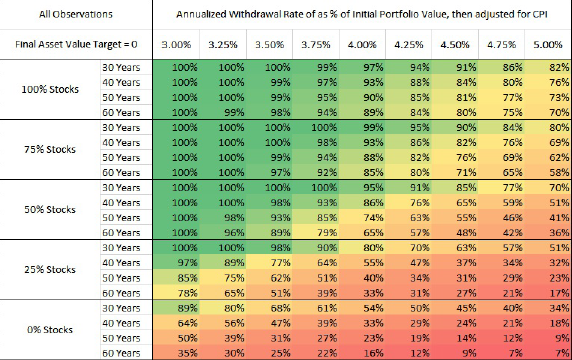
- Allocations of 75%-100% to stocks and constant real withdrawal rate 3.5% or lower offer high probabilities of success for all retirement horizons (see the table below).
- Success probabilities deteriorate materially when extending the horizon from 30 to 60 years, with 100% stocks preferable for the latter.
- For success defined by terminal value targets of 25%, 50%, 75% or 100% of portfolio value at retirement:
- For a 30-year horizon, capital depletion is so important to withdrawal rate that achieving terminal value targets is difficult without a substantial sacrifice in withdrawal rate.
- For a 60-year horizon, capital depletion is less important, such that equity weights 75% and higher and withdrawal rates 3.5% or lower offer strong success probabilities.
- Considering that CAPE is currently well above its long-term average:
- For a 30-year horizon and equity weights over 40%, every failure of a 4% withdrawal rate occurs when CAPE exceeds 20 at retirement.
- In contrast, for a 60-year horizon, lowering the stock allocation in response to high CAPE lowers probability of success. In other words, for the longer horizon stocks are better than T-notes even when stocks are overvalued. But, the maximum safe withdrawal rate for 100% stocks is only 3.25%.
- Even without accounting for any future reduction in benefits, Social Security payments do not substantially boost the safe withdrawal rate.
- Planning for a gradual decline in withdrawal rate during retirement may boost the safe initial withdrawal rate by 0.25%-0.50% depending on how aggressive the planned decline.
The following table, taken from the paper, summarizes probabilities of portfolio value remaining positive for allocations to stocks ranging from 100% to 0%, retirement horizons ranging from 30 years to 60 years and withdrawal rates ranging from 3% to 5% (with returns to stocks and T-notes as specified above). Results indicate that early retirement means higher allocation to stocks and lower safe withdrawal rate.
With the assumption of zero volatility for asset returns, these probabilities overstate (perhaps substantially) realistic success rates.
In summary, evidence indicates that the safe withdrawal rate for an early retirement portfolio in the current financial environment is less than 3.25%.
Cautions regarding findings include:
- As noted, the assumption of zero asset return volatility (confirmed with the corresponding, but anonymous, author) strongly biases portfolios toward success. Actual returns for stocks and bonds are volatile, and these volatilities would substantially reduce retirement portfolio success rates compared to reported results. Per the rule of thumb described in “When Potential Upside Is Bigger Than Potential Downside”, the average return used above overstates the long-term compound annual growth rate for U.S. stocks by over 1%. The corresponding author argues that: “The rationale for this: I am suspicious about the 4% [rule of thumb]. If I give it the best possible chance to succeed and show that even then it’s not a good rule over 50+ years I would argue I made my point.”
- The average asset return estimates derive from an historical sample period that encompasses only 2.4 independent 60-intervals in the sample, undermining confidence in their accuracy.
- The authors do not specify portfolio size at retirement, leaving each reader to calculate that value based on a safe withdrawal rate and a required retirement income.
- It is not obvious that CAPE reliably reverts to any particular average value and is therefore exploitable as applied. See “Usefulness of P/E10 as Stock Market Return Predictor”.
- The assumed “0.05% drag from fees for low-cost mutual funds” derives from recent data only. The authors also implicitly assume that the “funds” allow monthly portfolio rebalancing at no additional cost. Availability of such low fees in the past may well have affected stock and bond market behaviors (such as average return).
- It’s difficult to address the probability that a human being will adhere to the discipline of any particular withdrawal strategy for 60 years.